
 NEAR Protocol
 Quack AI
 Pearl
Pearl Zcash
Zcash Lighter
 Quantus
 Sui
Sui
- The stock price is currently trading at $189.45
- The Abrdn chart shows bearish sentiment
Recently, Abrdn announced the complete buy-out of the Amber-managed fund’s stake in Airband. Amber had a successful 5-year investment hold in Airband.
Airband has shown a major transformation from being a small rural focus fix wireless access (FWA) operator, to one of the largest full fiber rural networks in the country. This buy-out of stakes be one of the good investment made by Abrdn.
Abrdn Plc Stock (FRES): Financial Analysis
Abrdn’s financial report has shown decent growth in the revenue growth report from H1 2022 to H1 2023, with an overall growth of 0.03%. The previous H1 2023 revenue growth report was down by -0.02% from the H2 2022 report.
The Abrdn H2 2023 revenue report is estimate to have a growth rate of 0.01%.
The company has shown stable growth in revenue reports since the H1 2022 revenue report, which shows the company is capable of meeting the estimated revenue in H2 2023.
Abrdn paid an average dividend of $30 in 2020 and 2021. In 2022, the company has not paid any dividend, which shows that it has reinvested its net profit in 2022.
Abrdn Plc Stock (FRES) : Technical Analysis
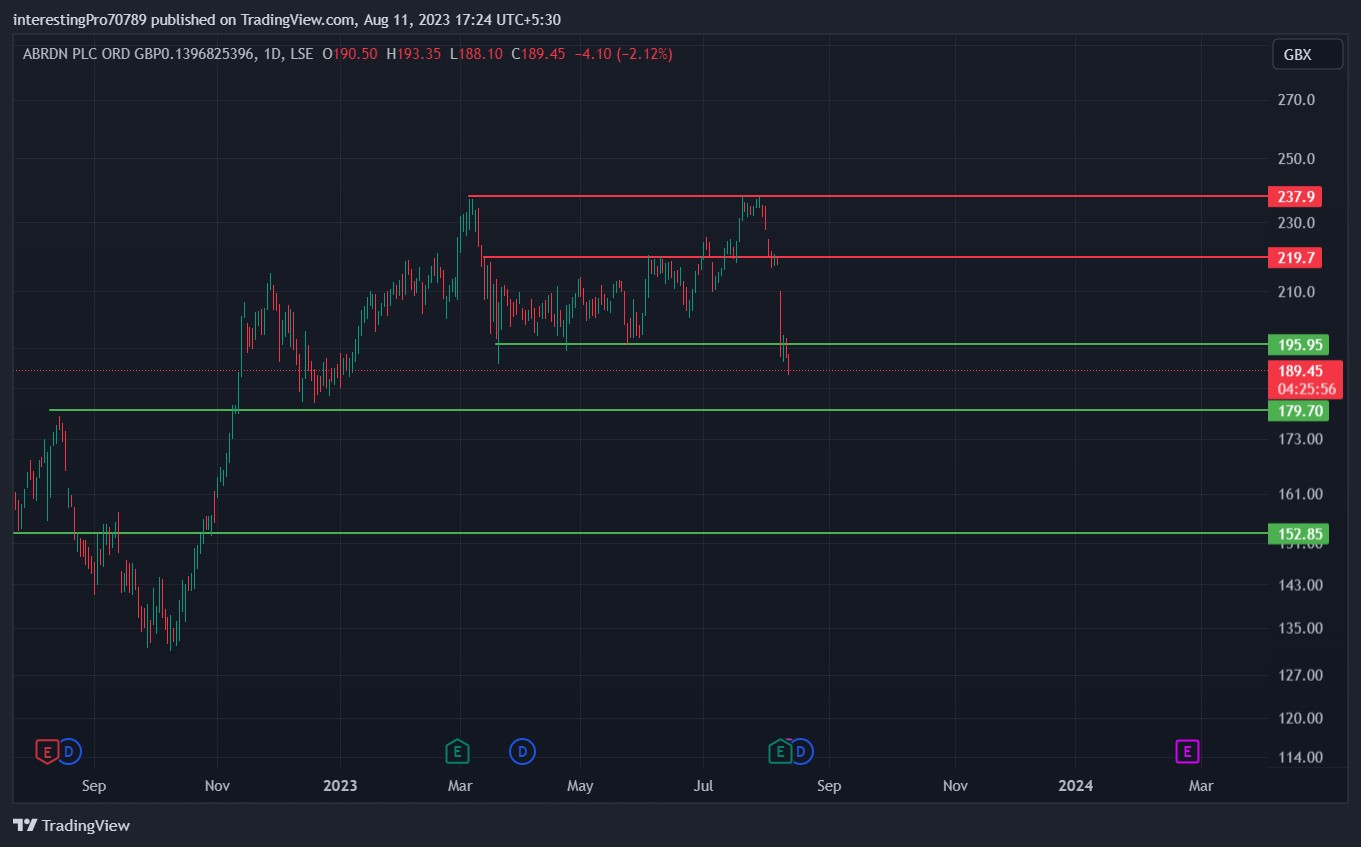
In December 2022, the Abrdn stock formed a support level of $179.70 and showed a bullish rally till the $237.9 level; from there, the price face rejection and was seen falling to $195.95. After that, the price stuck in a range of $195.95 to $219.7.
After a long consolidation of 5 months in the range of $195.95 to $219.7, the price was able to give the breakout of that range, but the price faced an immediate rejection. From the $237.9 resistance, and the price closed below the $219.7, which made that breakout turn into a fakeout, which led the price to fall from there.
Recently, the price has also given a breakdown of the $195.95 support level and currently the price is falling and trading below its support level The next support is at $179.70. If the price takes support from the $179.70 support, a pullback or retracement could be seen in the Abrdn chart. If the price fails to take support from the $179.70 support and breaks it, the price can be seen fall to the next support at $152.85.
Indicators
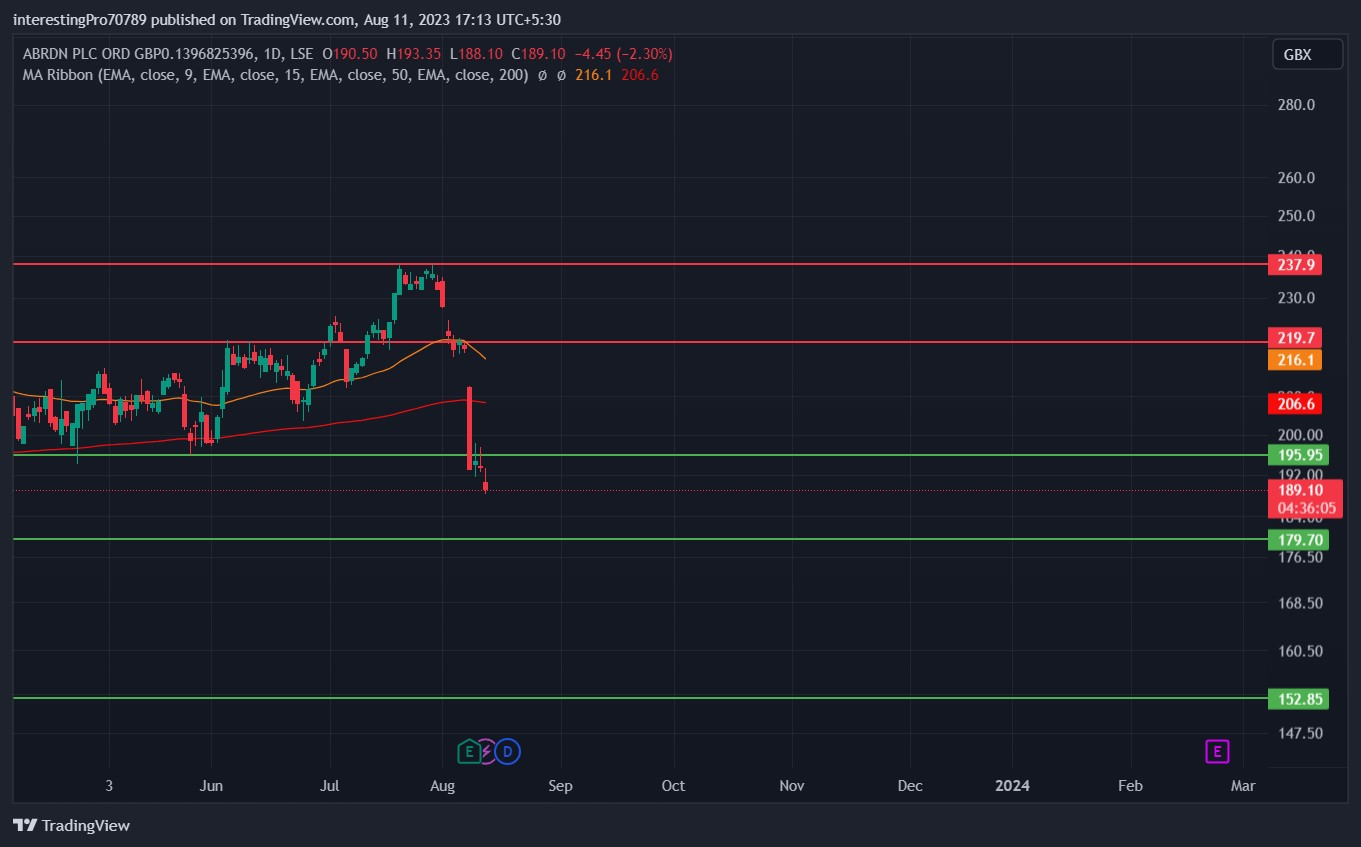
The 50 EMA (yellow line) is at $216.1, and the 200 EMA (red line) is at $206.6. Both the EMA’s are trending in a downward direction and a big red bearish candle was form across the 200 EMA, which indicates the seller’s dominance in the market. Currently, the price is trading below the 50 and 200 EMAs, which shows the clear bearish sentiment in the Abrdn chart. If a crossover of the 50 and 200 EMAs (also known as the golden crossover) can be seen in the future where the 50 EMA crosses the 200 EMA from upward to downward, the price can be seen fall even more.
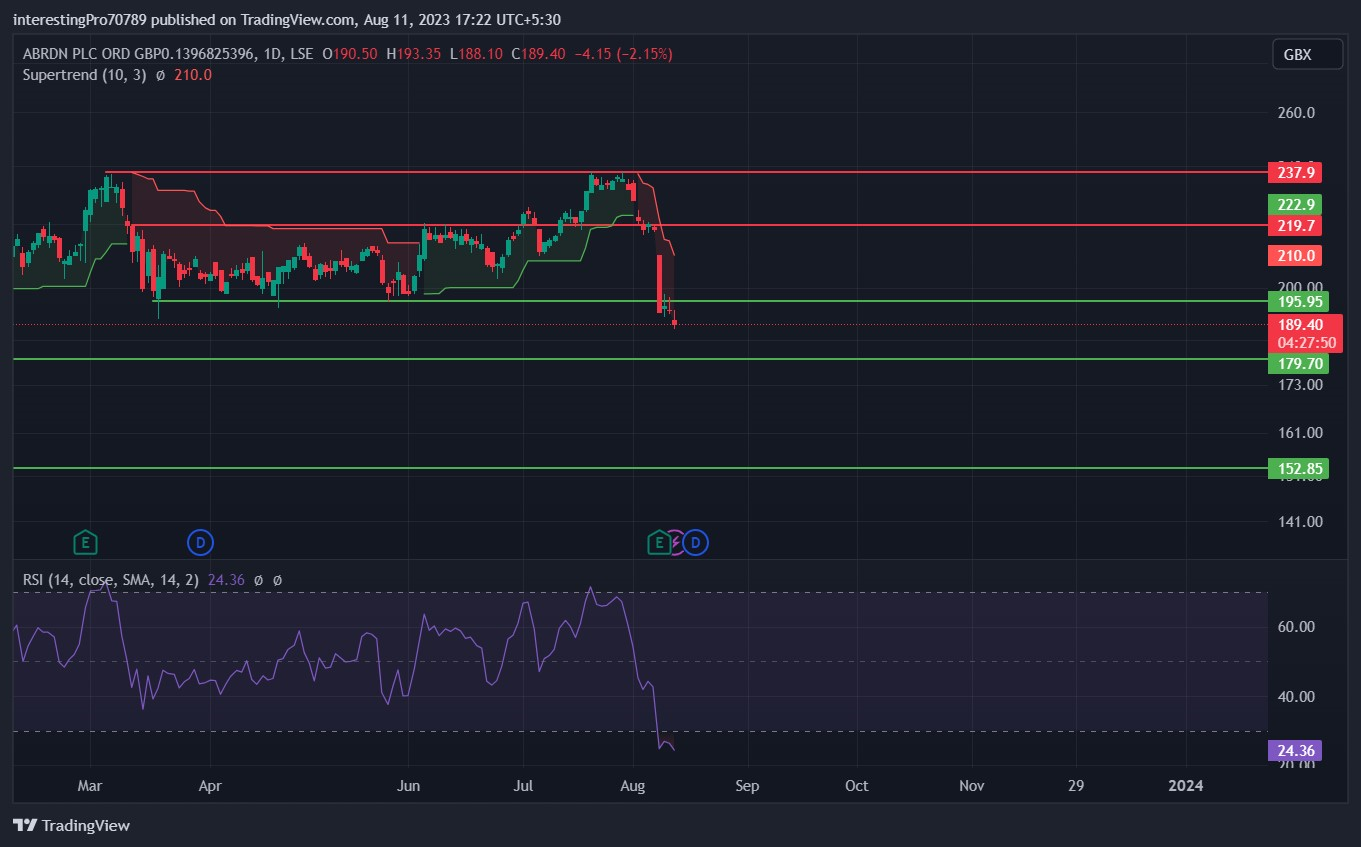
The relative Strength Index (RSI) is at 24.36, which shows Abrdn Plc Stock (FRES) price is in oversold territory. It indicates that a short-term pullback or retracement is pending.
The super trend indicates that Abrdn Plc Stock (FRES) price is in bearish sentiment as the price is trading below the red line, which shows the seller’s presence in the current scenario. If only the price closes above the red line, then only bullish sentiment can be seen in the Abrdn chart.
Conclusion
In conclusion, the overall chart of Abrdn is bearish. The price is in the absolute control of the seller. All the indicators mentioned above are bearish as of right now, but only the RSI is in oversold territory, which shows that a pullback or a retracement is pending in the short-term scenario.
Technical levels
Resistance levels: $219.7 and $195.95
Support levels: $179.70 and $152.85.
Disclaimer
The views and opinions stated by the author, or any other person named in article, are for informational purposes only. They do not provide financial, investment, or other advice. Investing in or trading crypto assets comes with a risk of financial loss.




