
 Quack AI
 Pudgy Penguins
 Starknet
 Pearl
Pearl Sui
Sui Celestia
 Quantus
- Wood Group’s price is currently trading at $164
- The Wood stock price is currently trading below the supply zone.
Wood Group is a worldwide consulting and engineering company that has been awarded a multi-year framework agreement. With SHELL to continue to provide its engineering and management expertise for SHELL projects.
Ken Gilmartin, the CEO of Wood Group, said that this award continues 70 years of relationship between SHELL and WOOD. Expanding in more than 20 countries and undertaking numerous project projects.
Can buyers dominate the sellers ?
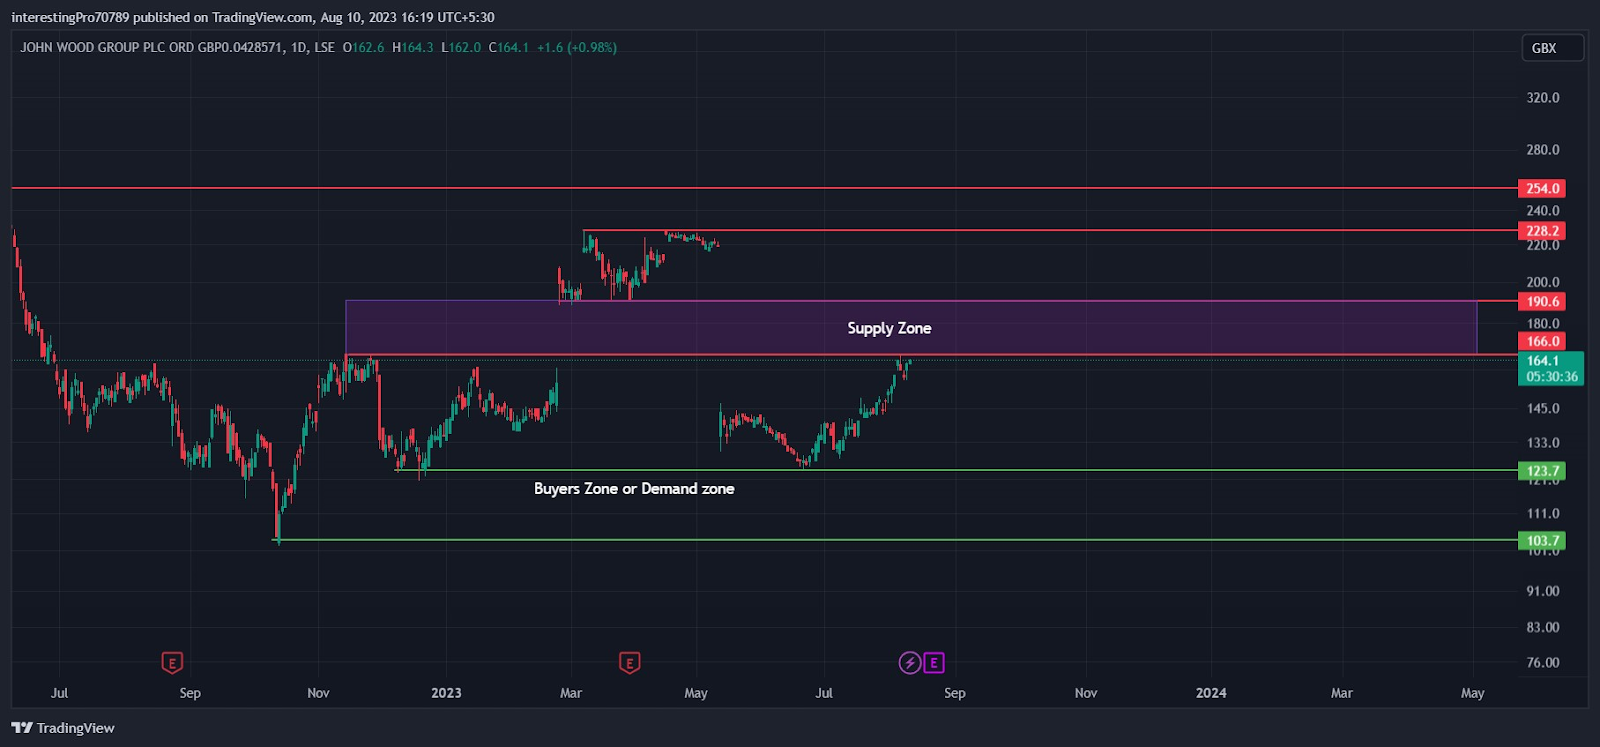
In December 2022, John Wood Group Stock price formed a support of $123.7, show a bullish rally to the $162 resistance level, and faced rejection from there. Around February, the price show a gap-up scenario and traded 20 points above the resistance level of $166 and consolidated in the range of $190.6, making it a support, and $228.2, making it a resistance. Then in May, the price showed a gap-down scenario, and the price was again seen at the $123.7 support level, and from the support level, the price again showed a bullish rally, showing the buyer’s presence at that support.
Currently, the price is trading just below the $166 resistance level. And there is a gap of 20 points from $166 to $190 still left where the price has not trade yet, which can be a very volatile zone. So for the price to move up and cover the gap that is still left, it should have to close above the $190 level. Then a bullish move can be expect to $228 and then to $254. And if the price faces rejection from the $166 resistance, then the price can be seen at $123.7 support.
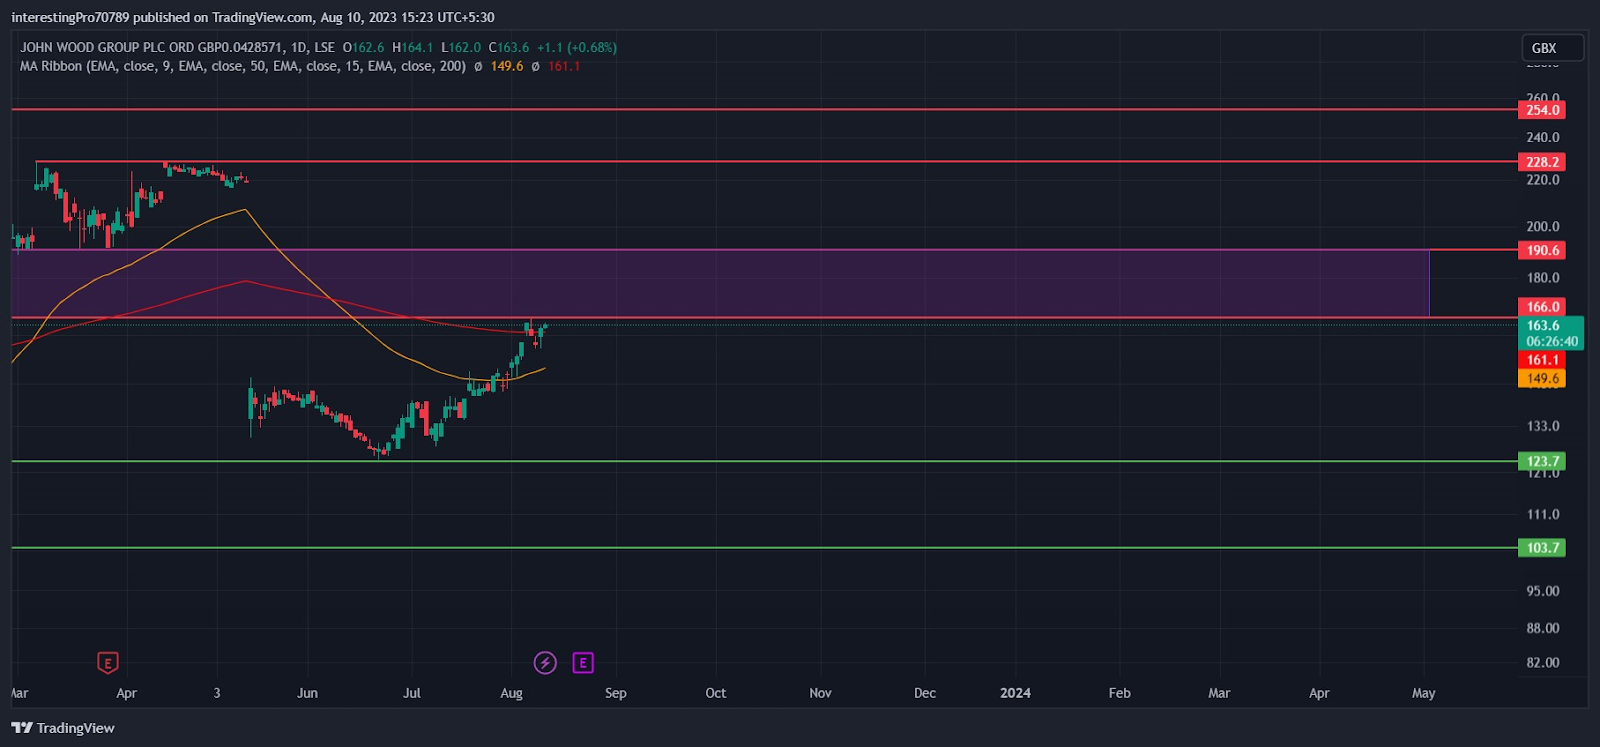
Technical Indicators prediction about the current trend
The 50 EMA (yellow line) is at $149.6, and the 200 EMA (red line) is at $161.1. Currently, John Wood Group Stock price is trading above both EMAs, which indicates that the price is in Bullish sentiment.
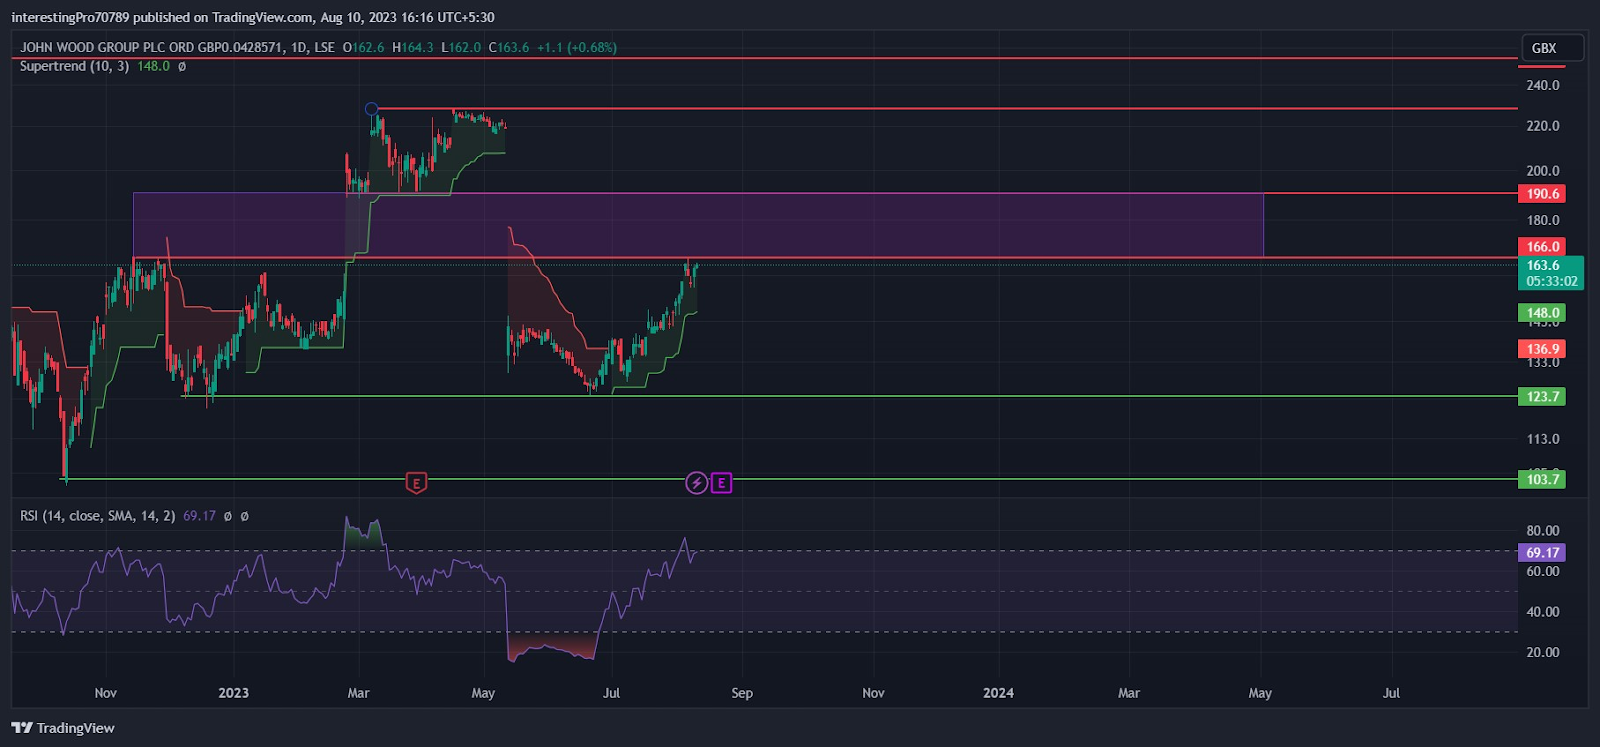
The Relative Strength Index RSI is at 69.17, which indicates that currently, the price of the Wood group chart is in bullish sentiment. But the RSI is almost in overbought territory, and the price is also heading towards its $166 resistance. So the first thing is that if the price manages to close above the $166 resistance level and reach the $190.6 resistance level. Then a pullback for the short term can be seen as the RSI would also be in an Over-bought territory. And the second thing is that the price can face rejection from the $166 resistance as the RSI can signal a pullback as it would be in overbought territory.
The Super-Trend indicates that the price is in bullish sentiment as it is trading above the green line. If the price takes rejection from the $166 resistance level, then the price comes down to test the green line of the super trend as a support. If the price of the Wood chart closes below the green line, then only bullish sentiment can be seen in the Wood Group chart.
Conclusion
The overall chart of Wood Group is bullish, as the buyers are dominating from the $123.7 support level. There’s a gap that fill in the near future, and the buyers are trying to fill the gap that is left. All the indicators are bullish as of right now.
Technical levels
Resistance levels: $166, $190.6 and $228.2
Support levels: $123.7
Disclaimer
The views and opinions stated by the author, or any other person named in this article for informational purposes only. They do not provide financial, investment, or other advice. Investing in or trading crypto assets comes with a risk of financial loss.




