
 Minter
 Pearl
Pearl NEAR Protocol
 Pons
Pons Quack AI
 Quantus
 Sui
Sui
- MRO stock price is trading at $524.6.
- The company stock is still in bullish sentiment.
Melrose Industries Plc is an investment company that was founded in 2003. The company manufactures airframes, engine structures, and interconnection systems for the global aerospace industry for both civil and defense platforms. The MRO develops and supplies extensive advanced aerospace systems, components and technologies which are used in business jets, helicopters, military aircraft and large passenger planes.
Melrose Industries Plc (MRO): Financial Analysis
Melrose Financial report has shown stable growth within the 12 months in the revenue report from H2 2021 to H2 2022 with an overall growth of 0.22%. In the previous three reports, the company was able to surpass the estimated revenue.
This time the company’s H1 2023 forecast is about 1.65B which is very low from the previous three revenue reports. The PFC revenue growth has shown a decent growth in revenue report which shows the company can meet the estimated revenue in the H1 2023 report.
Melrose Industries Plc (MRO): Technical Analysis
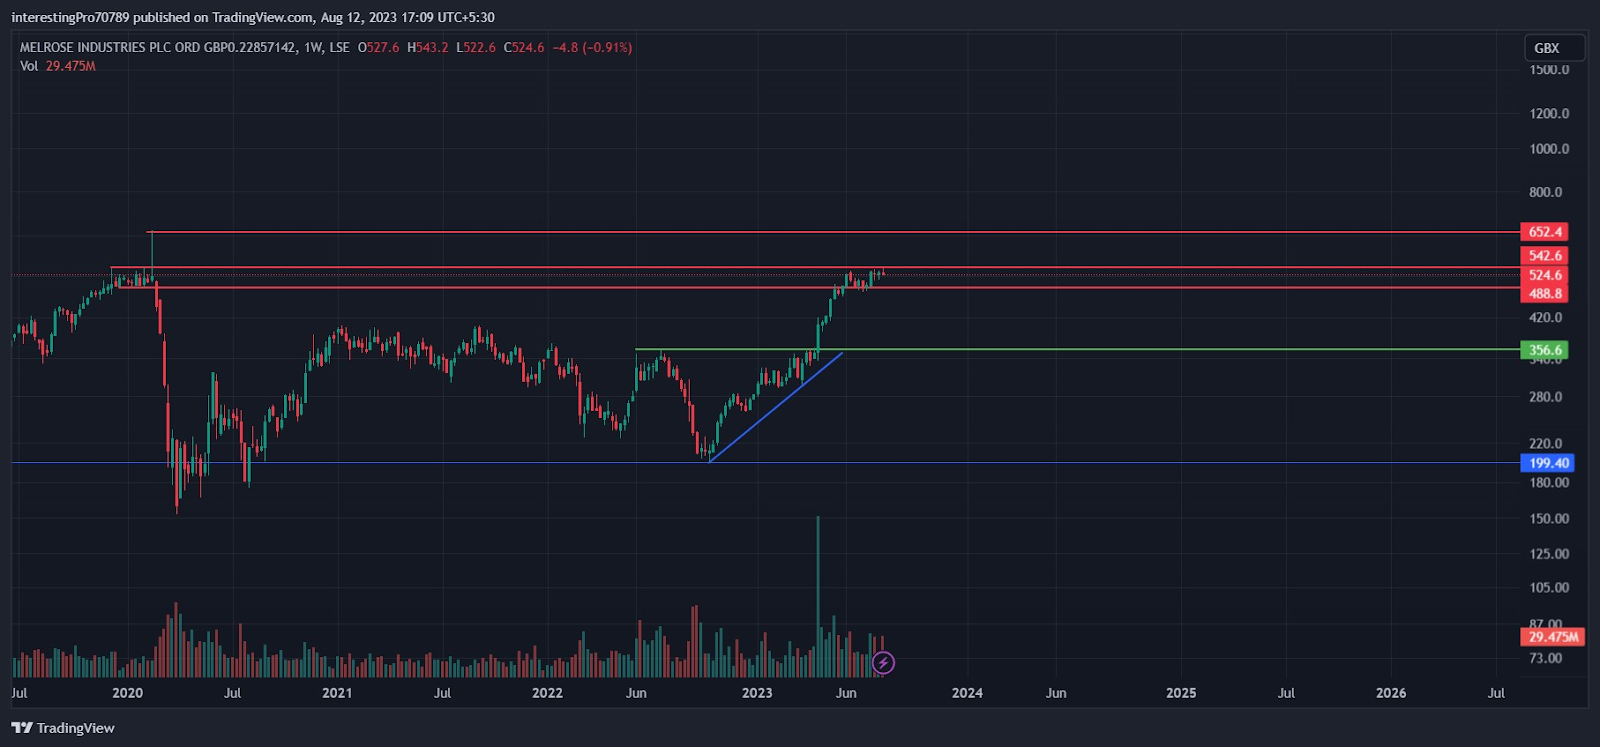
In June 2022, Melrose’s price was facing rejection from the $356.6 and in the next month, the price started falling. The price almost had a fall 44% to the $199.40 level. After that, the price showed a bullish rally and was again trading below the $356.6 level from the price that faced rejection previously.
On 20 April 2023, the company updated its free float share value to 1/3 split from 9/10 split. The company increased its free float share in the market (the higher the free floats means the investors can buy and sell a big number of shares without having a big impact on the price) which leads a big buying in the market on that particular day resulting in the price broke at $356.6 resistance level with a huge volume.
After the split event, the price showed a strong bullish momentum rally in the market till the $542.6 resistance level. Currently, the price is trading in the narrow range of $488.8 to $542.6. The market is in a very bullish sentiment right now, if the price closes above $542.6 the bullish rally can be seen again till $652.4 but if the price closes below $488.8 then it can be seen taking a pullback in the short term.
Technical Indicators Prediction about the current trend.
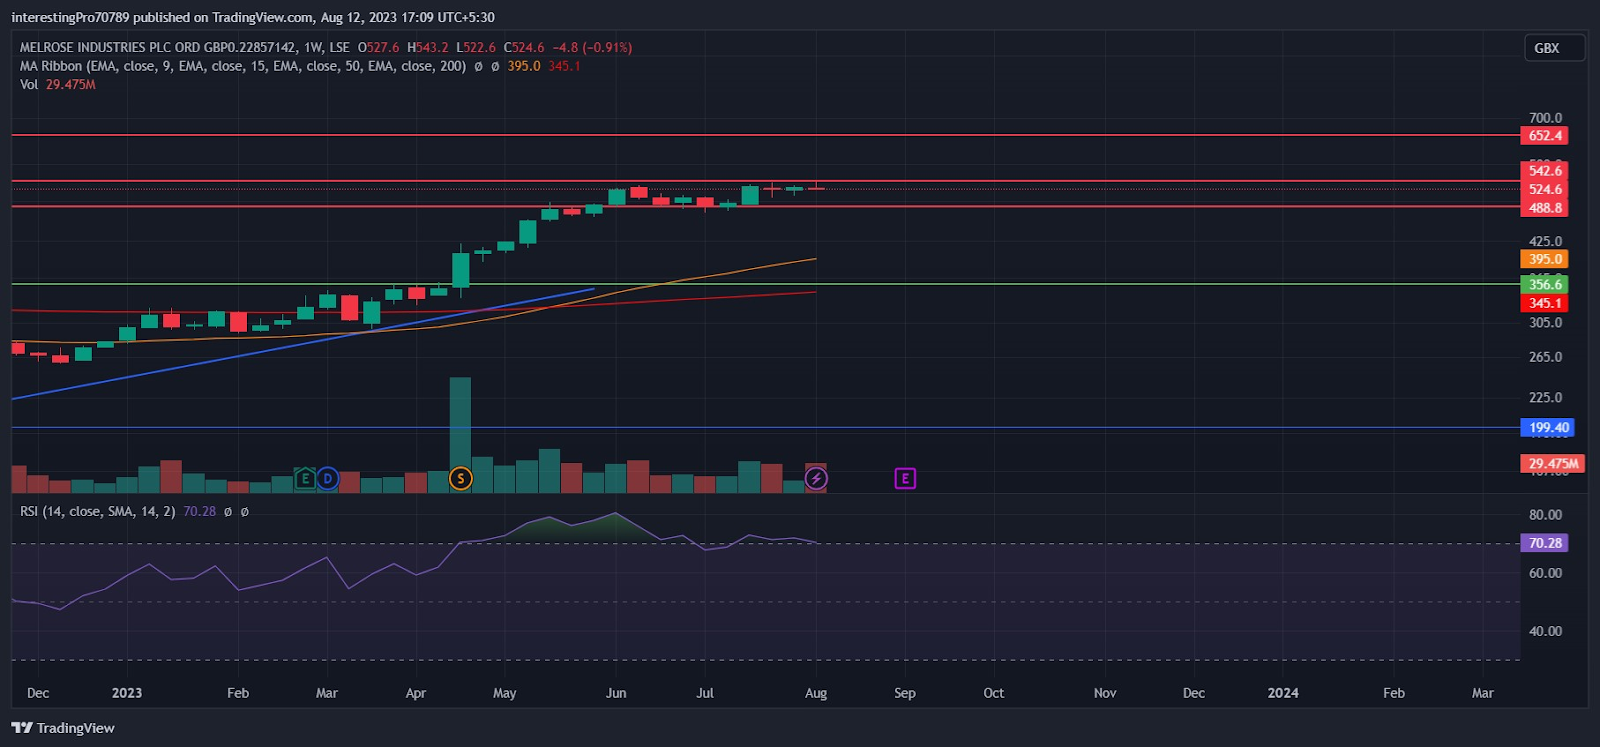
The 50 EMA (yellow line) is at $395.0 and the 200 EMA (red line) is at $345.1. Recently the EMA lines have crossed each other where 50 ema had crossed the 200 ema from the downward direction to the upward direction. The price is also trading above both EMA’s. This indicates the strong presence of buyers and the bullish sentiment in the market.
The relative strength index is at 70.28 and it is coming down from the overbought territory. This indicates that the price is in the bullish sentiment as of now.
Conclusion
The overall chart of Melrose is in bullish sentiment. A small pullback can only be seen for the short term if the price closes below $488.8. All the indicators mentioned above are bullish as of right now.
Technical levels
Resistance levels: $542.6 and $652.4
Support levels: $488.8 and $356.6
Disclaimer
The views and opinions stated by the author, or any people named in this article, are for informational purposes only. They do not establish financial, investment, or other advice. Investing in or trading crypto assets comes with a risk of financial loss.




