
 Minter
 Quack AI
 NEAR Protocol
 Pearl
Pearl Sui
Sui Pons
Pons Quantus
- SLB stock price surged 0.21% in the last trading session and is currently trading at $57.89.
- Schlumberger N.V.’s (NYSE: SLB) price is inclining and forming a parallel channel pattern.
SLB stock price was in an uptrend gaining 27.57% in the past 3 months. The stock price experienced a pre-result effect and made a bullish rally after the breakout of upper trendline resistance.
The stock price consolidated to wait for the quarterly results. The earnings of the results outperformed the expectation of the analysts and the investors took the quarterly results in a positive way and the price resumed its ongoing trend.
Schlumberger N.V. (NYSE: SLB) Schlumberger Limited is a global leader in oilfield services. It helps oil and gas companies find, drill, and evaluate hydrocarbon wells through its contracts.
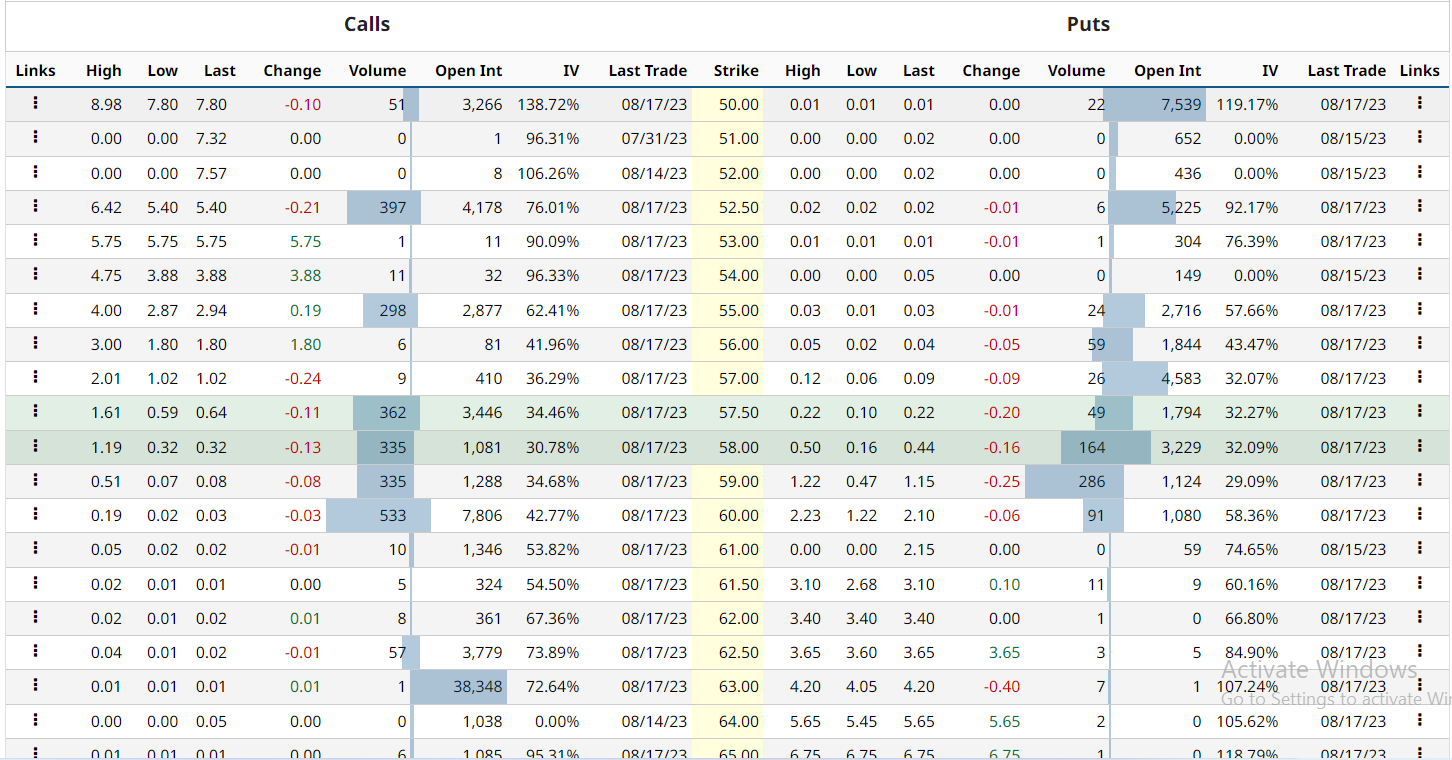
SLB stock option-chain analysis states that the current implied volatility in the market is 31.37% with an increment of 0.27% in the last trading session. The at-the-money strike price has 4,583 open contracts on the put side and 410 open contracts on the call side indicating the dominance of buyers at the current level. The PUT/CALL ratio is 0.94 indicating that call writers dominate the market as per the data.
SLB Stock Price Forming A Channel Pattern On Daily Chart
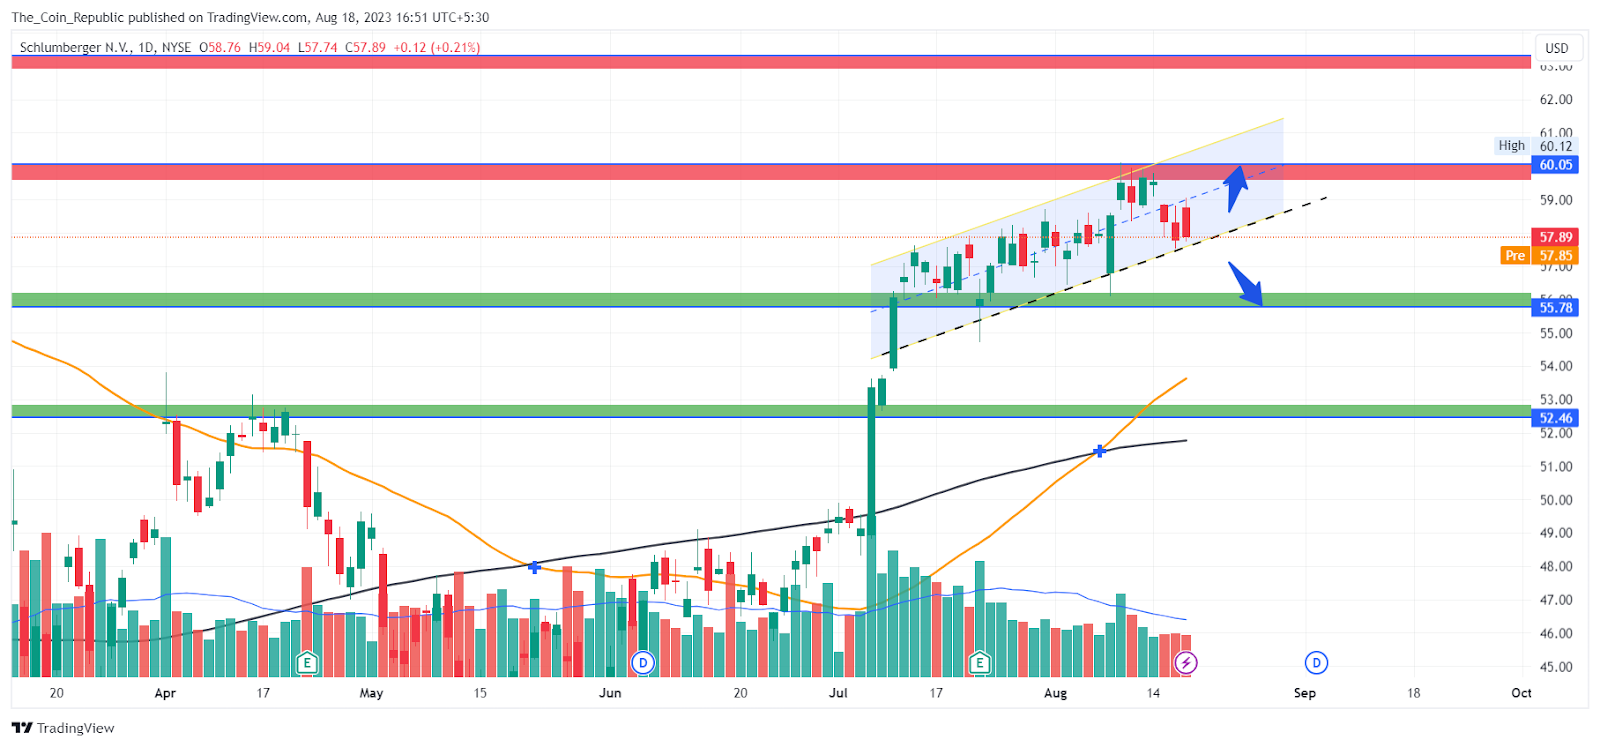
The SLB stock price currently trades at $57.89 and trading in a channel pattern and inclining. The short-term trend for the stock is currently neutral to bullish until the price manages to stay in the channel pattern. The stock might keep getting buying volume until it remains in the channel.
The price has turned its long-term trend to bullish and remain the same until the price trades above the 200 EMA. The price may show profit booking in the short term which may be an opportunity for buyers to enter the market and the price may hike again.
The EMAs Showing A Golden Crossover On the Daily Chart.
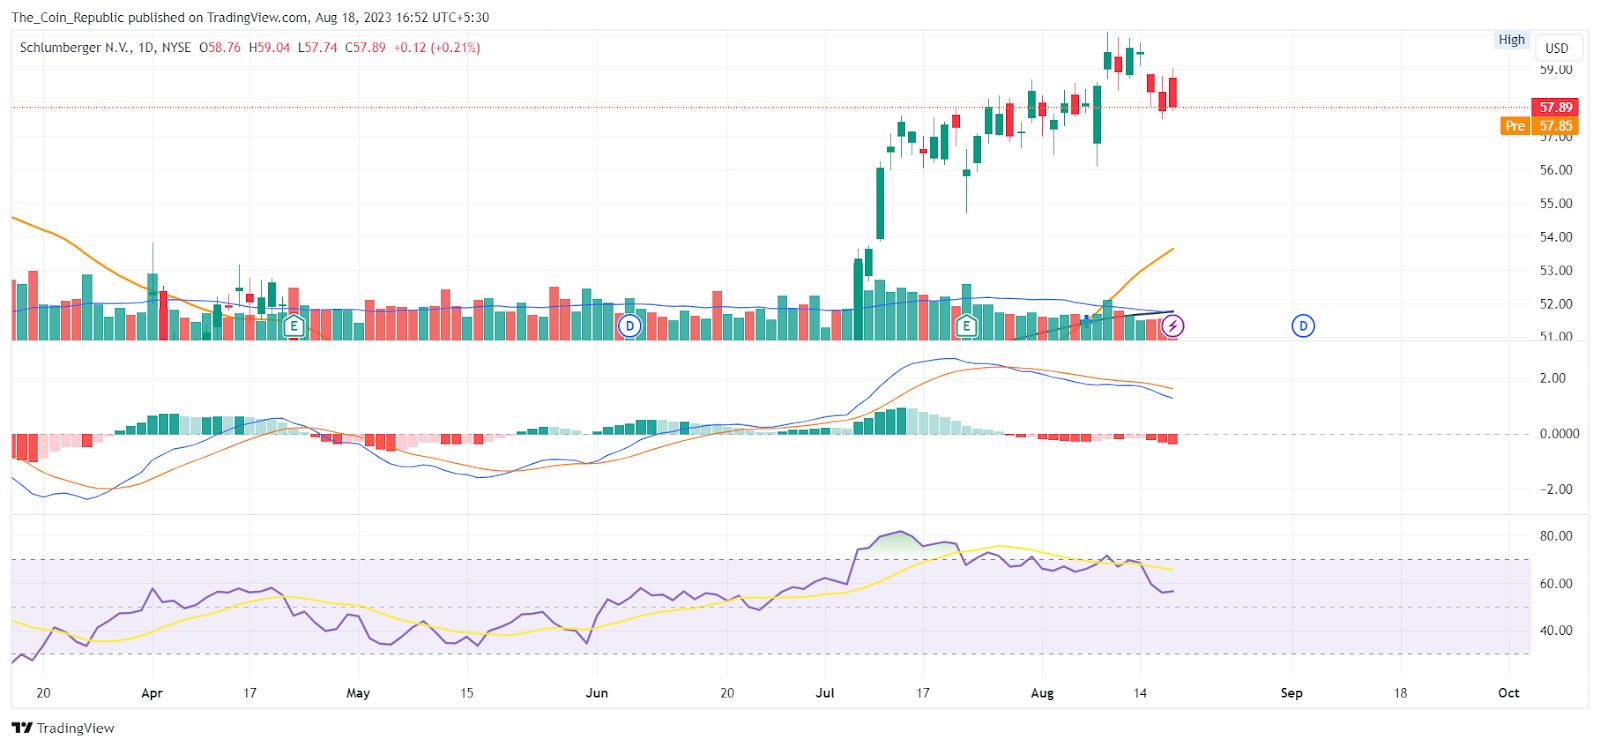
The daily SLB stock price chart shows that the price is trading above the 50 and 200 EMA indicating a strong trend prevailing. The overall Technical Opinion rating including RSI and MACD is signaling a 70% buy with a weakening short-term outlook on maintaining the current direction.
Conclusion
SLB stock price prediction concludes that the stock price has been rising in value for the last 3 months. It broke above a resistance line and rallied before its quarterly results, which were better than expected. The stock price is now trading in a channel pattern and headed upwards. The short-term trend is neutral to bullish as long as the price stays in the channel. The long-term trend is bullish as long as the price is above the 200 EMA. The stock may face some selling pressure in the short term, but that could be a chance for buyers to enter the market and push the price higher.
Technical Levels
- Support levels: $55.78 and $52.46.
- Resistance levels: $60.05 and $63.31.
Disclaimer
The views and opinions stated by the author, or any people named in this article, are for informational purposes only and do not establish financial, investment, or other advice. Investing in or trading crypto or stock comes with a risk of financial loss.




