
 Quack AI
 Pudgy Penguins
 Starknet
 Pearl
Pearl Sui
Sui Celestia
 Quantus
- The SMIN stock price is currently trading at 1558.5 GBX.
- The company chart has given a breakdown of major support of 1675.5 GBX.
Smiths Group Plc. (LSE: SMIN) is a diversified technology company. Samuel Smith founded the company in 1851. It provides critical solutions for energy and process industries. The company also provides after-sales to its customers which include various government agencies, hospitals, petrochemical companies, and many more.
Smiths Group Plc (SMIN) Stock: Technical Analysis
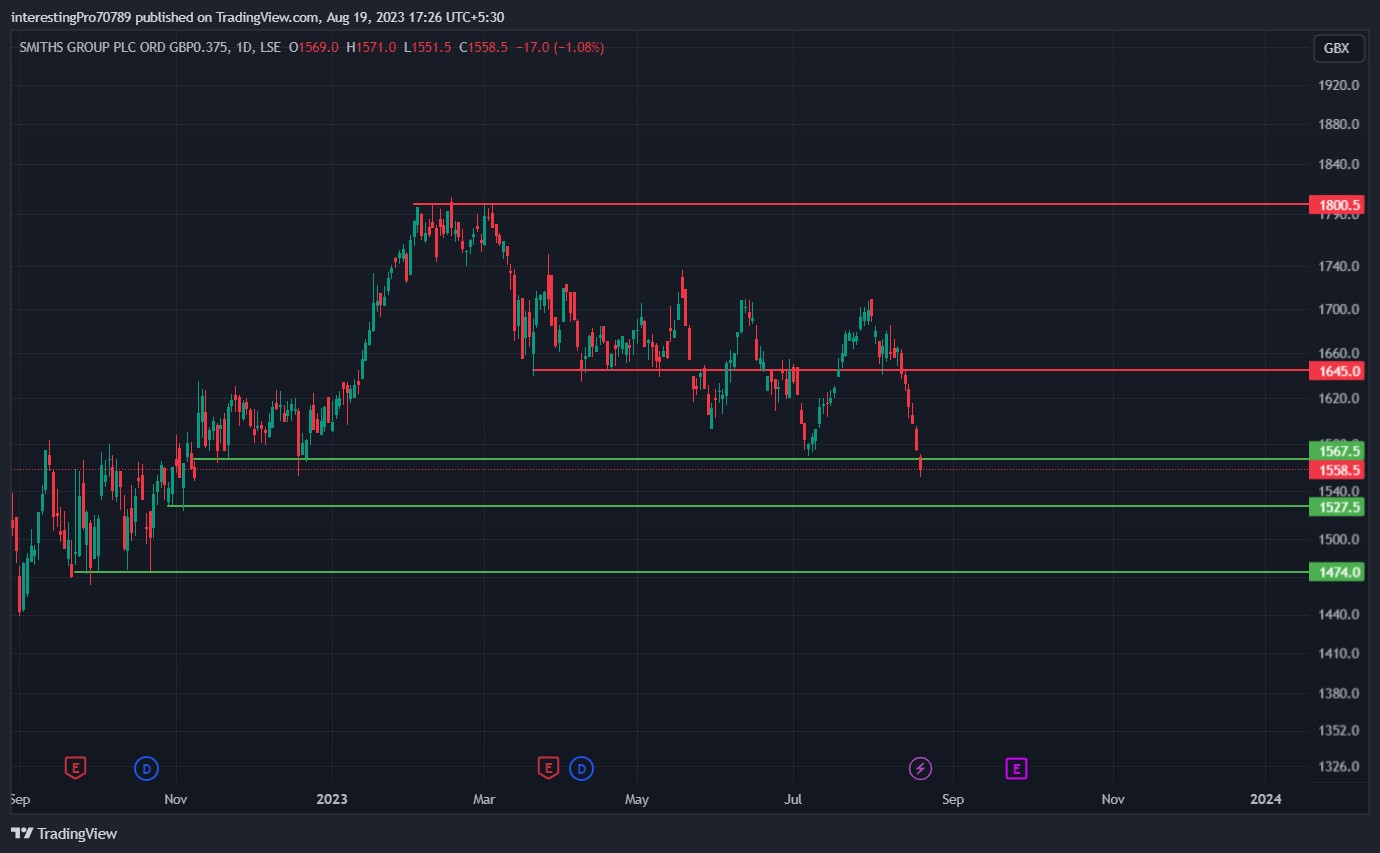
Currently, Smiths Group Plc. stock is trading at $1558.5 with an average volume of 501.666K and a market capitalization of $5.431 Billion.
In December 2022, the SMIN’s price took support from 1567.5 GBX and commenced a bullish rally till 1800.5 GBX. The price faced rejection and was seen falling to 1645 GBX. The price formed support at 1645 GBX and was seen sustaining over it.
In May 2023, Smiths Group Stock price gave the breakdown of the 1645 GBX support but was able to reclaim this support. The breakdown was turned into a fakeout. Again in June 2023, the price gave the breakdown of this level and went down to 1567.5 GBX support.
From this support, the price was again commencing a bullish rally till 1711.5 GBX. Again the price faced rejection and was seen falling to 1567 GBX support.
Currently, the price has given the breakdown of the 1567.5 GBX support. If the next candle breaks the low of the current candle then the price can be seen going to its next support at 1527.5 and then to 1474 GBX.
The price can only be see in bullish momentum if the price reclaims the current support and gives the breakout of 1645 GBX resistance. Then the price can be seen going to its next resistance at 1800.5 GBX.
Technical Indicators’ Prediction About the Current Trend
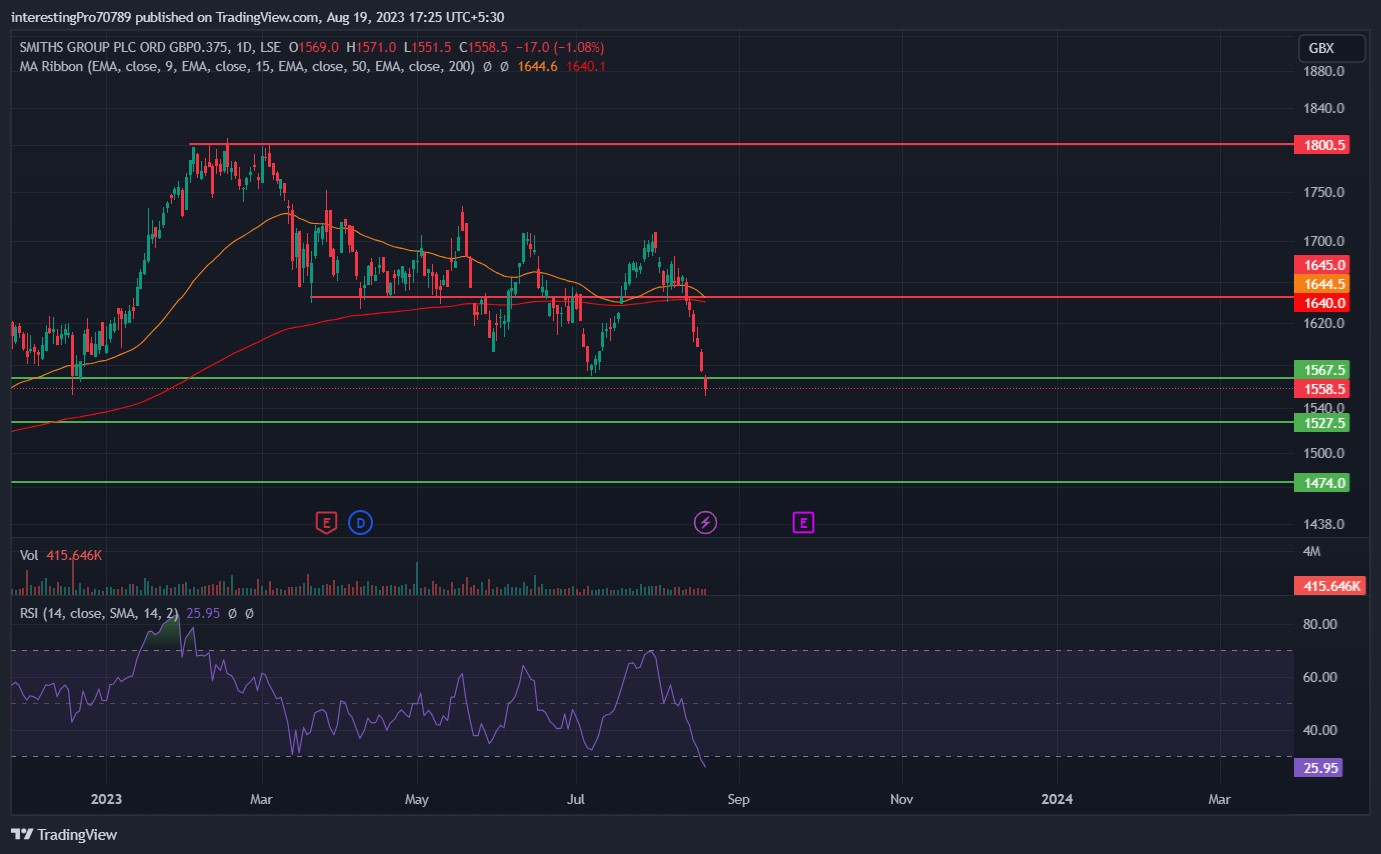
The 50 EMA (yellow line) and 200 EMA (red line) are between 1640-1645 GBX. The price of SMIN is currently trading below the 50 and 200 EMA which indicates that the price is in bearish sentiment. Moreover, the 50 and 200 EMA crossover can also be seen. But the EMA lines are very far from the price which indicates a pullback or retracement can be seen in the future.
The relative strength index RSI is at 25.95. The RSI line is at the oversold territory. This indicates that the pullback in the price can be see in the future.
Conclusion
The Smiths Group chart is currently bearish as the price has given the breakdown of 1567 GBX support. All the indicators are bearish at the time of writing. But indicators are showing some signs which show that the price can be seen moving in the upward direction in the future.
Technical levels
Resistance levels: 1645 GBX and 1800.5 GBX.
Support levels: 1567.5 GBX, 1527.5 GBX, and 1474 GBX.
Disclaimer
The views and opinions stated by the author, or any people named in this article, are for informational purposes only. They do not establish financial, investment, or other advice. Investing in or trading crypto assets comes with a risk of financial loss.




