
 streamoors
 IGNITION
 Quantus
 Sui
Sui Zcash
Zcash Ethereum
 Pearl
Pearl
- Dynex capital financial highlights and statement analysis.
- Despite the downfall in operating revenue over a span of 5 years, the company is providing dividend payout ratios of more than 100%.
- DX stock price is seen moving towards its support after crossing its 50 EMA.
Dynex Capital Inc is a listed company on the New York Stock Exchange (NYSE) and is headquarter in Glen Allen, Virginia. Dx was found in 1987 and the company is classified as a mortgage real estate investment trust.
Dx Capital invests in senior classes of non-agency residential securities back by mortgages (RMBs), and others (MBs) like bonds, real estate debt, home loans, and relate assets. Dynex Capital makes revenue through the dividends generate from the financing of real estate assets, and from long-term gains on similar properties.
Financial Analysis of Dynex Capital Inc.
As a real estate investment trust (REIT), the company’s revenue performance is notably unappealing, evident from its consecutive negative growth of 18% since 2019. This decline stands in contrast to the broader real estate industry, which is experiencing a Year-on-Year (YOY) growth rate of 5.1%.
The income statement also shows how the profit margins of Dynex capital have been consistent. As a REIT, it must pay over 90% of its taxable income to shareholders. This requirement from the law has given Dynex a full corporate tax exemption. With positive earnings per share (EPS) for 3 years, this stock has provided good returns to its shareholders.
Looking at the balance sheet, the company’s cash has increased significantly, which has resulted in good current ratios over the years. However, the company’s reserves show a negative balance, primarily due to the distribution of dividends that have surpassed its earnings, resulting in an accumulated deficit.
The cash flow statement of the company brings light to the company’s secret of cash balances in the balance sheet. Dynex has been net cash flow positive for 5 years now.
Key Highlights of the 2022 Annual Report
The revenue of the firm as report in its last annual report is $86 Million, which is a 43% growth on a year-on-year (YOY) basis, and this revenue was follow by an operating profit of $54 Million.
The company has reported zero taxes paid, resulting in both pretax and net income being identical at $135 million, reflecting an $88 million increase from non-operating profits. The firm boasts a 100% gross margin due to the absence of Cost of Goods Sold (COGS), while its operating margin, as disclosed in the annual report, stands at approximately 73%. The net profit margin of the company is recorded at 1.24%.
Impressively, the company maintains a robust dividend payout ratio exceeding 100%, accompanied by an average dividend yield of 11% over the years. The Return on Equity (ROE) for common stockholders, according to the latest annual report, is a respectable 18%.
Considering its presence in the asset-heavy real estate industry, the company bears a slightly elevated debt level. The Debt to Equity ratio stands at 2.93, reflecting the industry’s nature and financial structure.
The Metrics have been calculated by financial statements, provided by macrotrends.net
Technical Analysis of Dynex Capital Inc
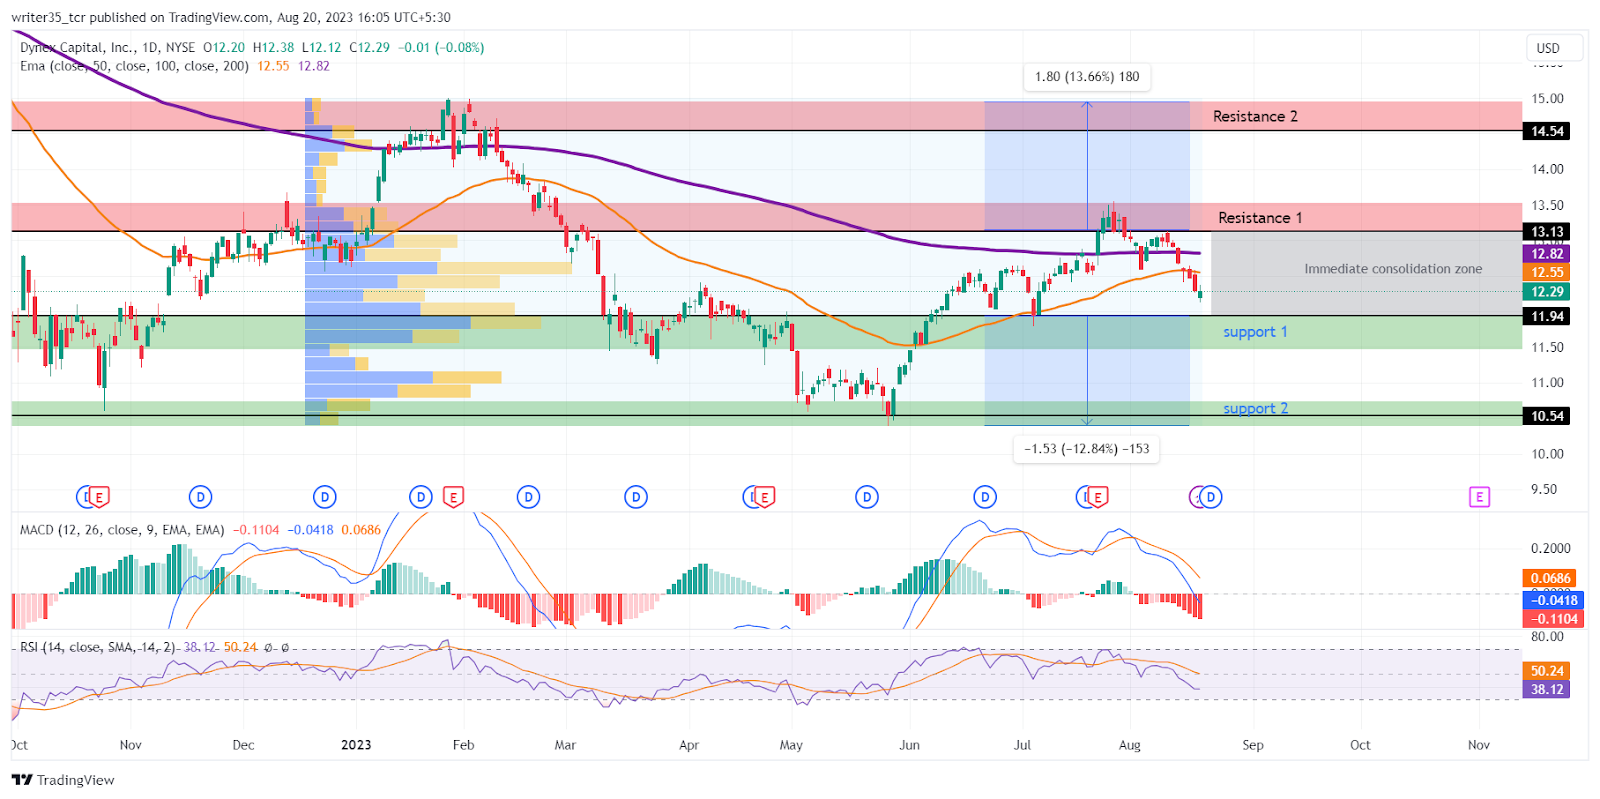
At the time of writing, the stock price of DX has encountered resistance and faced rejection as it attempted to surpass its supply zone. Currently, the price is observe to be retracing back towards the supply zone. Amidst this price action, the indicators are providing noteworthy insights into the stock’s potential direction in the near future.
The first and immediate support level is being form at $11.94 which was a previously broken resistance level, while the second support is at $10.54.
Just like the support levels, the immediate resistance is being made at $13.13 where the bulls have just face rejection, while the second resistance is form at the level of $14.54.
Additionally, the MACD indicator is indicating a recent downtrend in the stock price. This downtrend is evident from the bearish crossover between the signal line and the MACD line, which occur at the beginning of August this year and has contribute to the ongoing downward movement in the stock.
At the time of writing, the MACD line is at the level of -0.0418 below the neutral zone of zero while the signal line is at the level of -0.0686 above it.
Moreover, the relative strength index (RSI) is below its neutral territory and is moving towards an oversold zone of 30, in a bearish trend.
The RSI line made a bearish crossover with its SMA during the last days of July this year, after which the downtrend started. The RSI and its SMA are at the levels of 38 and 50, respectively
Furthermore, the EMAs have some different indications. The DX stock price took support from its 50 EMA back in June and July and now it has just crossed the 50 EMA and came below it, which means that the current bearish pressure is high. The current levels for 50 EMA and 200 EMA are $12.55 and $12.82, respectively.
Are Dynex Capital Shares Worth Buying?
From a long-term investor’s perspective, the stock operates within a stable industry and follows a consistent business model. The company’s revenue growth is notable, and its dividend distribution approach suggests a focus on providing attractive dividend returns rather than reinvestment. For long-term investors seeking steady income, considering this stock for its dividends could be a wise choice.
From a trader’s viewpoint, the stock’s near-term outlook appears bearish. It has recently dipped below its 50-day EMA and is approaching its immediate support level. Indicators are not strongly indicating a potential rebound. If a turnaround does occur, it would require overcoming the challenge of surpassing both the 50-day EMA and the 200-day EMA, which could prove to be a significant hurdle for bullish momentum.
Conclusion
Dynex Capital is a list company on the New York stock exchange which is involve in the business of REITS. The company is seen to be provide good and consistent dividend with a stack of cash on its balance sheet. Investors with an objective of dividend earnings can invest in this stock, but for short-term traders, a bearish momentum is predict.
Technical levels
Support: $11.94, $10.54
Resistance: $13.13, $14.54
Disclaimer
The views and opinions stated by the author, or any people named in this article, are for informational purposes only. They do not establish financial, investment, or other advice. Investing in or trading crypto assets comes with a risk of financial loss.



