
 Doge Pepe
 Covenant x402
 Tetsuo Super Intelligence
 Claudia
 hi
hi Pudgy Penguins
 Hyperliquid
- BHP Group Ltd released its H2-2023 report on 21 August 2023.
- BHP is trading at 2195.5 with a loss of 0.07% during the intraday session.
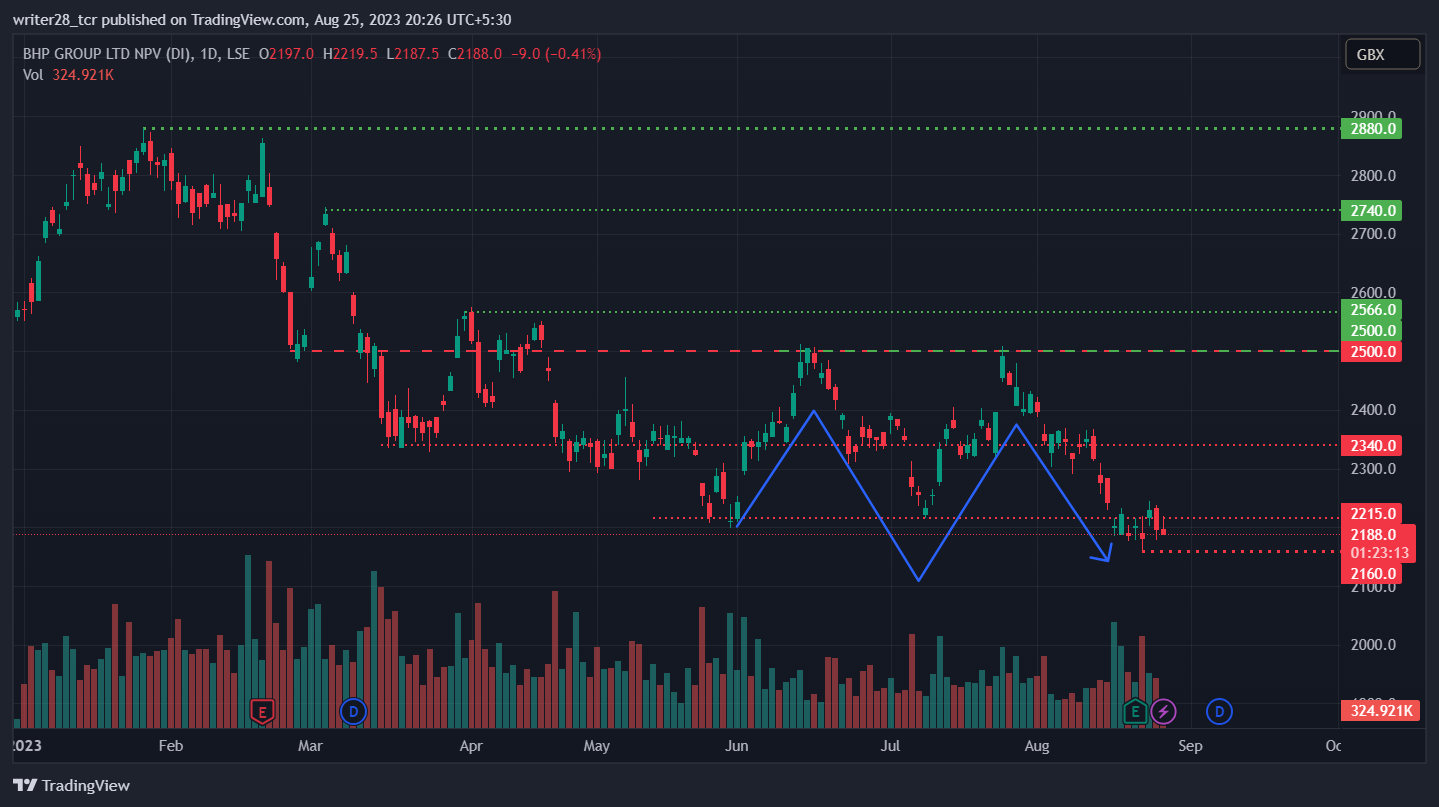
BHP stock price experienced a downfall after being halted at an annual high with a resistance level of £2880.5 since January 2023. It shifted downward while showing a downtrend trajectory. It halted at several lower highs along with lower lows. However, the bearish trend sustained towards the support level of £2207.0 on 25 May 2023.
The stock price then bounced back while derailing the downtrend. It surged about 13% and stayed at the resistance of £2500 level. Furthermore, this same pattern is repeated again. Hence, BHP stock has experienced a double top with another £2500 resistance level on 25 July 2023.
BHP Group Ltd announced its H2-2023 Report.
BHP Group announced its second half-yearly financial report on 21 August 2023. It reflects optimistic results with a surprise of 2.89%. The reported EPS (earning per share) was £1.06 and the estimated forecast was £1.03.
However, the reported revenue reflected opposing results with £22.19 Billion. It failed to match the £22.37 Billion estimated revenue forecast. That resulted in a loss of 0.80%.
The present market scenario reflects a bearish momentum. If it sustains, the price might melt toward the £2120 level. It may achieve a new annual low while bypassing the current annual low.
Suppose the bulls resist bears and derail the current downtrend, the price may surge and retest the significant support level of £2215 and further to the £2340 level.
Will BHP Attain A New Annual Low.
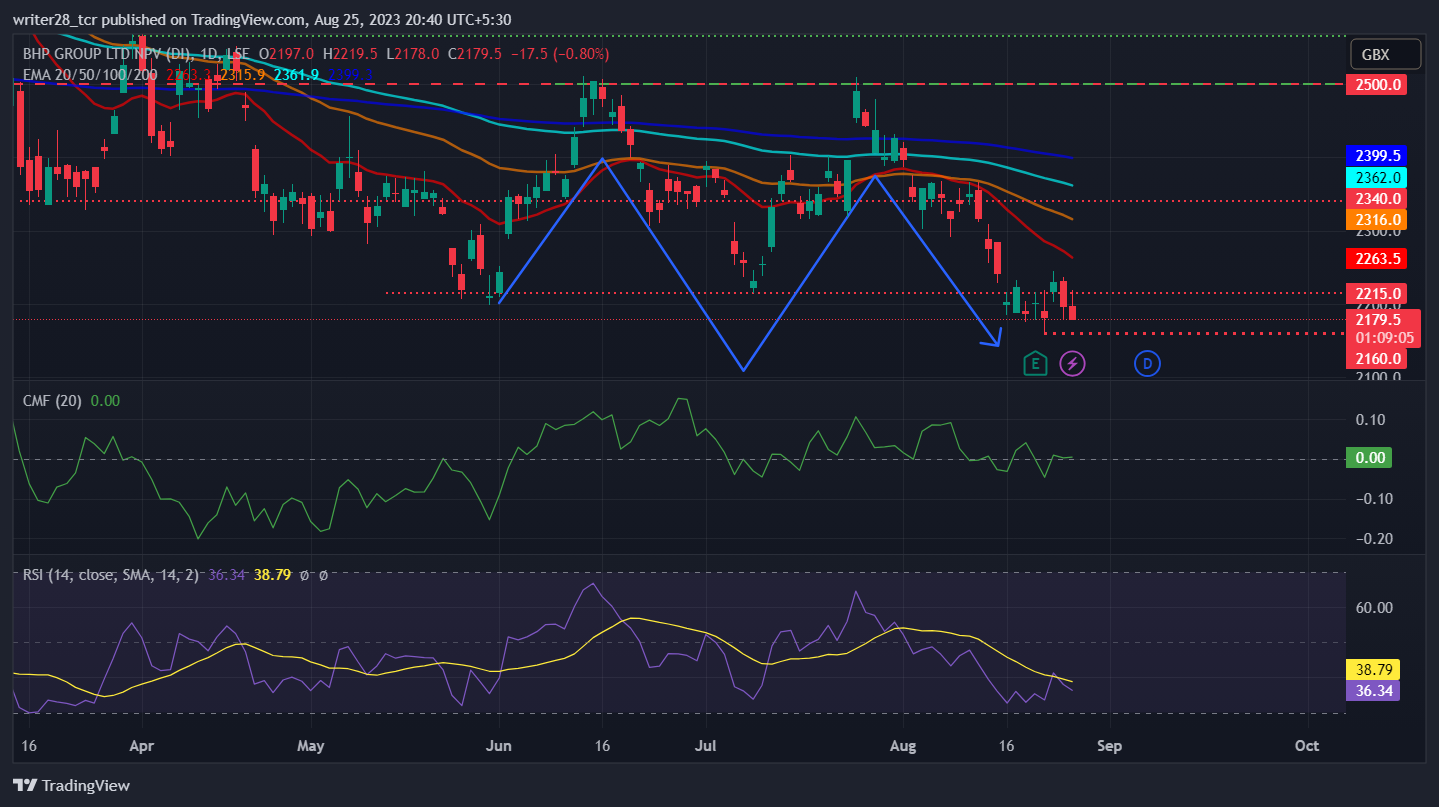
The CMF (Chaikin Money Flow) score is 0.00 during the intraday. It neither demonstrates weakness nor strength and the price might consolidate.
The BHP stock price trades below the 20, 50, 100, and 200-day EMA. It indicates weakness in the market and the rise of bearish momentum.
The relative strength index (RSI) trades at 36.34. It reflects the heavy involvement of sellers in the market during the intraday session.
The market capitalization of BHP Group Ltd is £112.93 Billion, with an average volume of 1.14 Million shares.
Conclusion
The BHP Group Ltd is witnessing a downtrend as the bearish momentum is rising in the price action. The high probability of further downward is on the verge. However, technical parameters indicate a bearish momentum. Investors should look for the selling opportunities as the indicators reflect the same.




