
 Dacity Coin
 NEAR Protocol
 Quantus
 Bitcoin
 Celestia
 Pearl
Pearl Pudgy Penguins
- LGEN stock has been trapped in a bearish trend for a long time, delivering a negative 15% return in 2023.
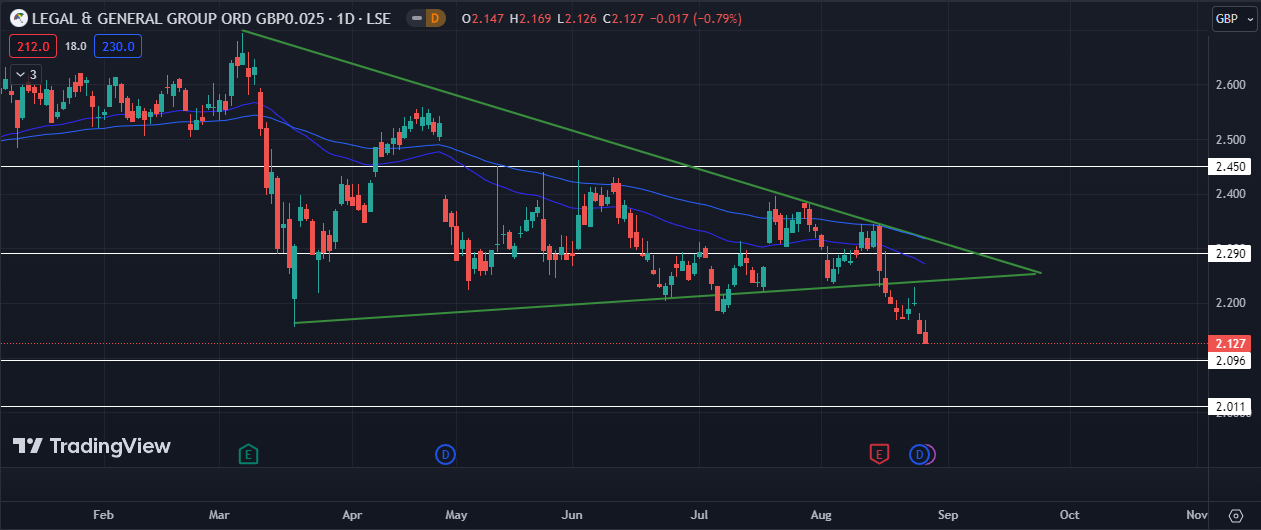
- The stock has been respecting a bearish trendline which started in March and is intact till date.
- The stock has also seen a sharp selling in a week, which has brought the price to crucial levels.
LGEN Group plc, commonly known as Legal & General, is a British multinational financial services and asset management company headquarter in London, England. Its products and services include investment management, lifetime mortgages (a form of equity release), pensions, annuities, and life assurance.
It has operations in the United Kingdom and United States, with investment management businesses in the Gulf, Europe and Asia. Legal & General is list on the London Stock Exchange and is a constituent of the FTSE 100 Index. Legal & General Investment Management (LGIM), the asset management arm of L&G, is the 10th largest investment management firm in the world. It is also the second largest institutional investment management firm in Europe.
Financially, even though the current revenue numbers are huge, there has been a constant decrease in revenue since the past three years. The last two quarters of 2022 saw a negative revenue for the company after a very long time. 2023’s first quarter has been positive and investors expect the future to be similar.
Technical Analysis
LGEN stock has seen a highly volatile year so far, but it has been trap in a bearish trend since the very beginning. The stock has faced rejection from a negative trendline thrice, reflecting its strength. The entire setup looks highly bearish as of now, since there has been constant sharp selling since a week, leading the stock to touch its yearly low levels.
We can see a breakdown of the Descending triangle that has been forming in the stock. The stock has also constantly formed bearish hammers, indicating a very strong selling side.
The immediate target and support for the stock is currently at £2.096. If the LGEN stock is unable to sustain above these levels, £2.011 is our next target below which a free fall can be expected.
If the stock does touch £2.011 and sustains at that level, it can be a positive sign moving ahead. And stock shows a few signs of recovery like increased buying volumes, then levels above £2.1 can be a good entry price.
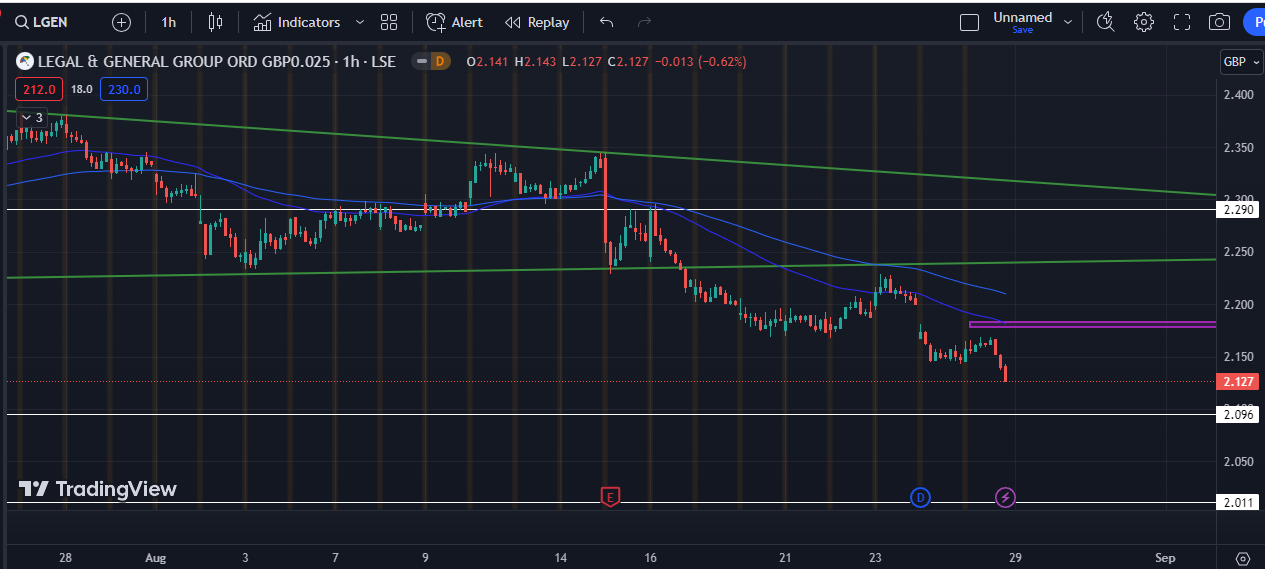
An hourly chart shows an even further negative side of the stock. After giving a confirmed breakdown, the stock tried to sustain at £2.171 but failed to do so. The past three candles have been strong bearish candles, promising a further downside movement.
The stock is very close to two strong support levels and if the stock sustains these, we can then expect an upside moving ahead. As of now, the stock looks highly bearish and no entry should be made until the stock gives a positive confirmation.
£2.18 currently stands as the first resistance for the stock in case there is an upside, followed by 2.29£.
Conclusion
The current setup looks highly weak as there are a huge number of sellers in the market. Until and unless the prices cool down and sellers exit the stock, investors should not make an entry. If the stock sustains above the current support levels, then those levels can be a good entry price. If not, then one should wait for the stock to show signs of recovery.
Important technical levels
Major support levels: 2.096£ followed by 2.011£.
Major resistance levels: 2.18£ followed by 2.29£.



