
 Boomer
 Covenant x402
 Claudia
 Pearl
Pearl Quantus
 Bitcoin
 NEAR Protocol
- The stock price of US steel has experienced a gap-up opening of more than 25%, know the reason below.
- A deviation is seen as the stock is closing back from its small breakout levels.
- After follow-up news, the investors are selling again.
US steel shares made a gap-up opening on the 14th of August this year after the news started floating around the market. The privately held family company, Esmark made an all-cash offer for the US steel corporation. It valued US Steel’s shares over 54% of the current price.
Although the hyper-bullish rally didn’t continue for long. Esmark Inc. reported in an email statement that it had changed its mind about buying US steel on August 23. This made the US steel stock price go as low as 3.2%.
Esmark Inc’s CEO, Jim Bouchard said that the USW was their partner in a successful acquisition deal of Wheeling Pittsburgh Steel. So, they have decided to remain close with them as a gesture of respect to USW.
Technical analysis of US steel (X)
The US Steel stock price has currently broken a resistance, but the sale has arrived after the withdrawal news. The stock came up with its immediate resistance but the bullish rally for the stock will go slowly as compared to its previous volumes.
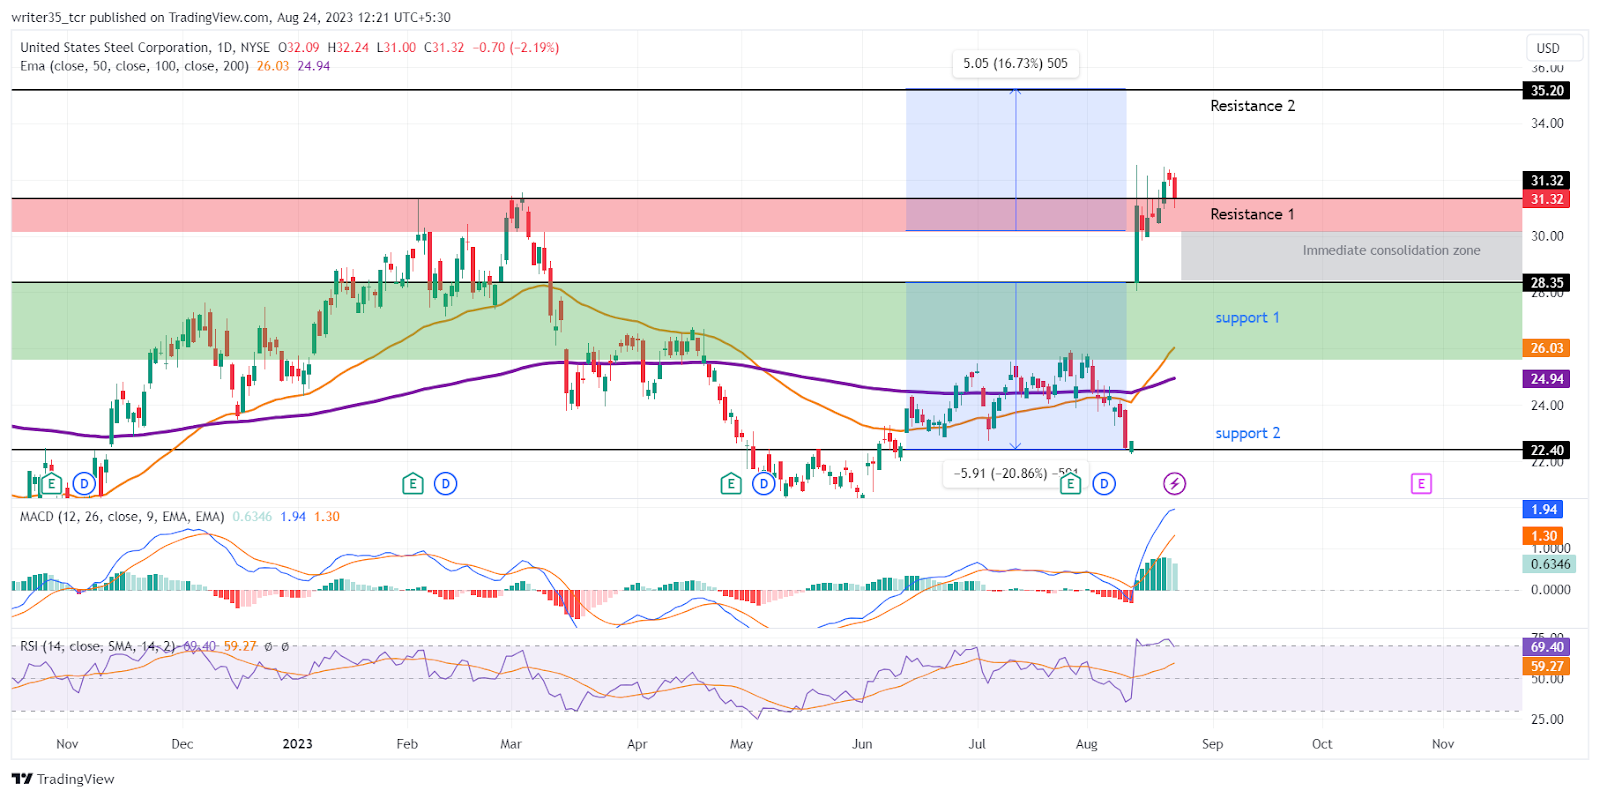
The US steel stock price is trading at the level of $31.3 at the present time between 2 supports and resistances. The first support is at the level of $28.35 where the stock ended its gap-up opening.
However, the zone of immediate support is wide with its end reaching up to the level of $25. The second support is down below $22.4.
The resistance zones have some interesting insights. The stock price has crossed its first resistance of $31.32. It is the same level as the current price, but likely to come down below. Moving up, the second resistance is at the level of $35.2.
What the Indicators are Saying?
Between the supports and resistances, Indicators like RSI are touching their overbought levels of 70 while its SMA is down below 59. Indicating immense strength in the bullish volumes.
A somewhat similar pattern is observed in the MACD chart. The MACD line made a bullish crossover with its EMA back in the Gap Up opening on the 14th of August of this year. Currently, the MACD line is at the level of 1.94, while its EMA is at 1.30.
The EMAs on the other hand are far below the current pricing action due to the gap up. However, the 50 EMA has made a bullish crossover with the 200 EMA. The levels are $26.03 for the 50 EMA and $24.9 for the 200 EMA.
Conclusion
The prediction for the US Steel stock price will be bearish. The stock has reacted to the news and the support levels are down. The current fake-out is looking like a deviation that will lead the price back into the consolidation zone.
Technical levels
Support: $28.35, $22.40
Resistance: £31.3, $35.2
Disclaimer
The views and opinions stated by the author, or any people named in this article, are for informational purposes only. They do not establish financial, investment, or other advice. Investing in or trading crypto assets comes with a risk of financial loss.




