
 Quantus
 Pearl
Pearl Quack AI
 Starknet
 NEAR Protocol
 Zcash
Zcash Aerodrome Finance
- The price of the CSX corporation stock has advanced by +24.38% in the last 5 years.
- The current market cap of CSX share is $61.454 Billion.
TheSX company has 2.006 Billion shares floating in the market for trading. The beta for the company is 1. It shows the stock moves relatively equal to the whole market.
The EPS for the company is $1.98, which means the company earns 1.98 USD for each share. The Company works in Road and Rail Industry. An average volume for the company is 12.4 Million. The 52-week range for the company is $25.80 – $34.38.
The market cap of CSX has advanced by +9.7% YOY declined by -4.3% resulting in $1.86B. The net cash at company has advanced by +32.0% and the inventory has also advanced by +12.7%. With a rise in inventory, the long-term debt for the company has also increased by +11.8%.
CSX Debt Analysis
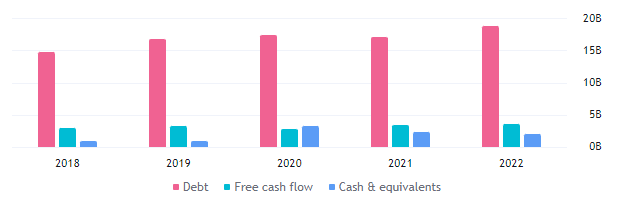
The company’s debt has increased from $16.91 Billion to 18.60 Billion in 2022. It is a negative sign for the company. However, the free cash flow has improved from $3.31 Billion to $3.49 Billion. That’s a reasonable figure for the company’s performance.
CSX Technical Analysis
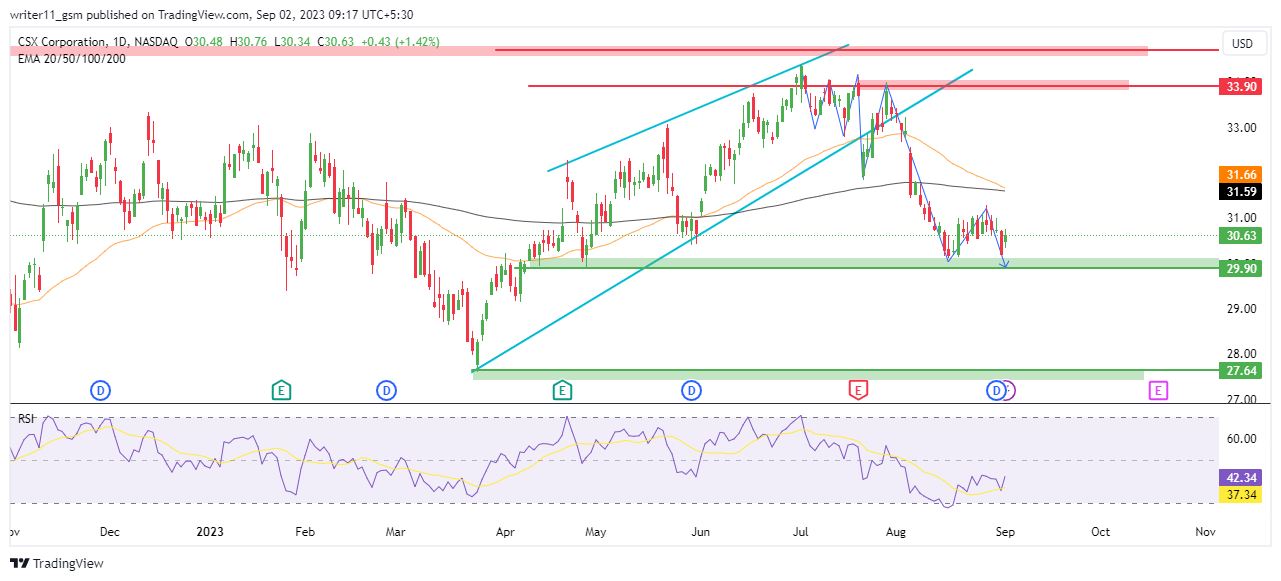
The CSX stock price has been dropping from the higher levels, making lower and lower swings. It indicates that the market is in a short-term downtrend and the sellers have the upper hand. The sellers may drive the price down more and alter the main trend of the stock.
The CSX Corporation share is under the 20, 50, and 200-day EMA. It has also experienced a bearish crossover of the 20-day and 50-day EMA. That shows the market is weak and the share may decline further. The share may also encounter a death cross on the charts!
The market is weak and the sellers have the upper hand. The RSI is at 42.34 and the 14-day SMA line is below the 50-level. The RSI and the 14-day SMA line have stayed under the 50-level for a long time. That indicates a lack of strength and momentum in the market.
Technical Overview of CSX Stock
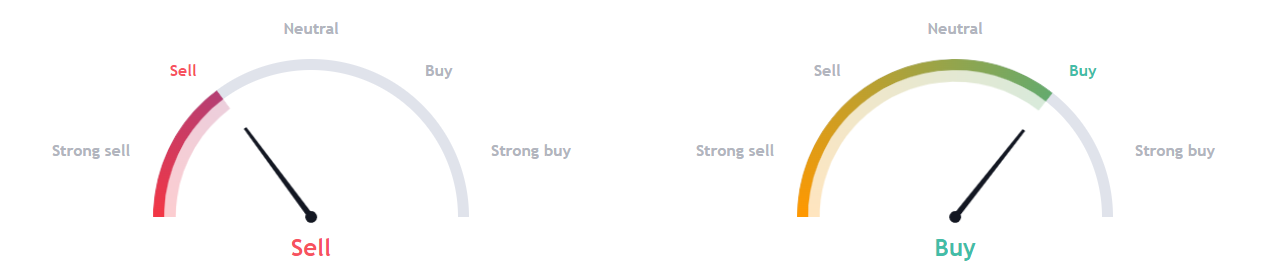
Tradingview data reveals that the technical indicators are suggesting a sell signal. The nalysts, who are advising a buy, are optimistic about the stock.
Conclusion
The stock is in a downward trend. It is creating lower and lower swings. The EMA’s are negative and the RSI is under the selling zone. The company’s profit margin is also worse than its peers. It implies that the stock may suffer more losses in the future.
Technical Levels
- The support levels for CSX Stock are – $27.00 and $30.00
- The resistance levels for CSX stock are – $33.00 and $35.00
Disclaimer
The information provided in this article, including the views and opinions expressed by the author or any individuals mentioned, is intended for informational purposes only. It is important to note that the article does not provide financial or investment advice. Investing or trading in cryptocurrency assets carries inherent risks and can result in financial loss.




