
 Boomer
 hi
hi Claudia
 Covenant x402
 Pearl
Pearl Quantus
 Bitcoin
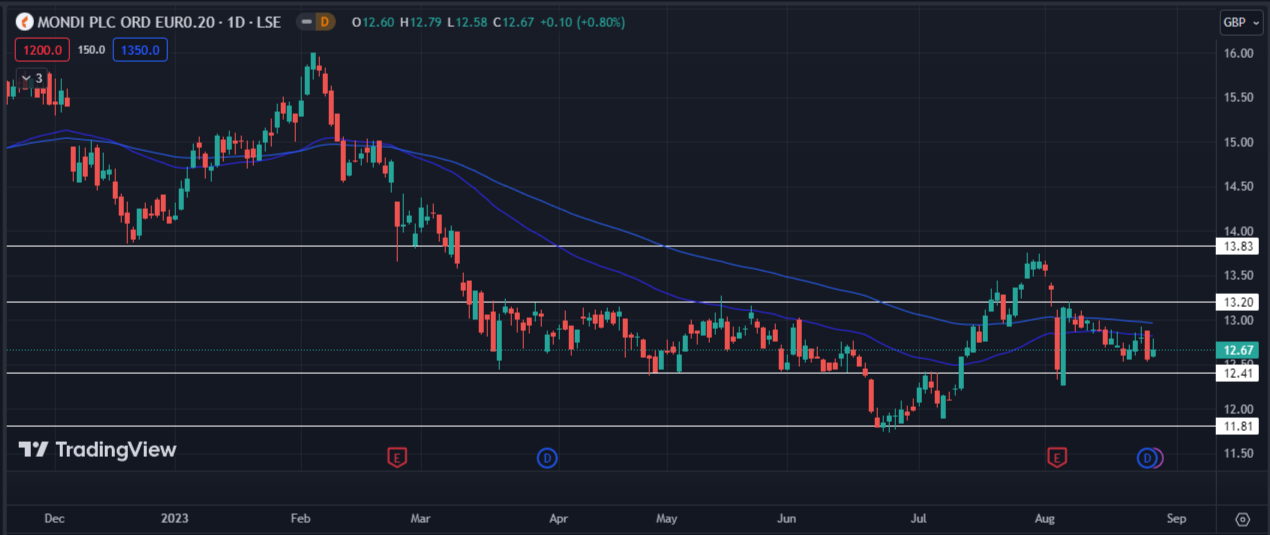
- Mondi Plc stock had traded in a highly strong zone till June when it gave a big breakdown. It was immediately follow by a buying.
- The stock faced a rejection from its resistance at £13.82 and has gotten stuck into the same old range once again.
- The current setup looks confusing and a big move might be waiting on either side.
Mondi PLC is a multinational packaging and paper group. It is employing around 21,000 people on more than 100 production sites across 30+ countries. It operation are spread predominant in Europe, Russia, North America and South Africa. This firm’s offices are locate in Weybridge, United Kingdom and Vienna, Austria.
Financially, the company looks quite strong with a constant net revenue from operations. It registered a strong increase in the net income in the last 2 years. These reports are highly positive for the company’s stock and its investors.
Technical analysis for the company:
Mondi stock has been trading sideways for most of this year. The zone between £12.41 and £13.2 has been highly strong. The stock has traded in between this range for a considerably long time now. The stock faced a rejection from £13.82 and saw a sharp selling post, but it managed to sustain above £12.41.
Current setup looks weak for the stock because the buying side is not highly visible. Adding to this, 50 and 100 EMA are seen resisting the stock, which technically means a downside.
Until the stock trades above £12.41, there is no need to worry. If we see a breakdown from these levels, £11.81 becomes our next target and support level. If the stock comfortably sustains above this, we can expect some bullish movement going ahead.
Suppose the stock in the upcoming weeks breaches its resistance at 13.2£, we may expect a big breakout ahead. Levels above 13.83£ can be consider as a good buying zone with £14.3 and £15 as immediate targets.
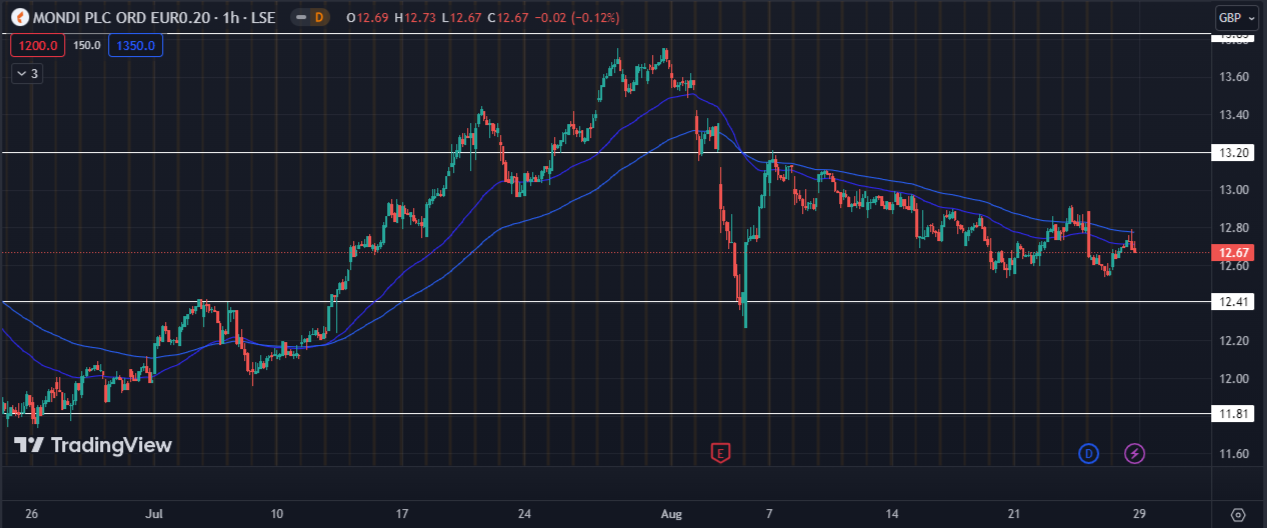
On an hourly chart, the setup looks highly bearish. Sellers are clearly overpowering the buyers. The stock is currently offering good selling confirmations.
£12.54 has become a local support for the stock. If it breaches that support in the upcoming days, we can expect a good downside then.
All technical indicators too suggest a highly strong selling ahead. A big move is less likely to occur if the stock trades in between its range of 12.41£ and 13.2£. If we see the stock breaching these levels at either side, a big move may follow.
Conclusion:
The overall setup for the stock looks highly bearish. The stock is stuck in a very strong zone and investors must wait for the stock to move out of it. Levels above £13.8 look strong for a buying side. You must wait for a few weeks before making any move in the stock.
Important technical levels:
- Major support levels: 12.41£ followed by 11.8£.
- Major resistance levels: 13.2£ followed by 13.83£.
Conclusion:
The overall setup for the stock looks highly bearish. The stock is stuck in a very strong zone and investors must wait for the stock to move out of it. Levels above £13.8 look strong for a buying side. You must wait for a few weeks before making any move in the stock.




