
 Covenant x402
 hi
hi Boomer
 Doge Pepe
 Claudia
 Quantus
 Pudgy Penguins
- National Grid stock has seen a highly volatile 2023, creating a high of £11.8 and a low of £9.39 within a span of just 3 months.
- The stock has been almost flat in terms of returns this year making its inventors highly anxious.
- After creating a yearly low at £9.38, the stock saw an instant and sharp buying. It predicts a new bullish momentum.
Technical analysis for the stock
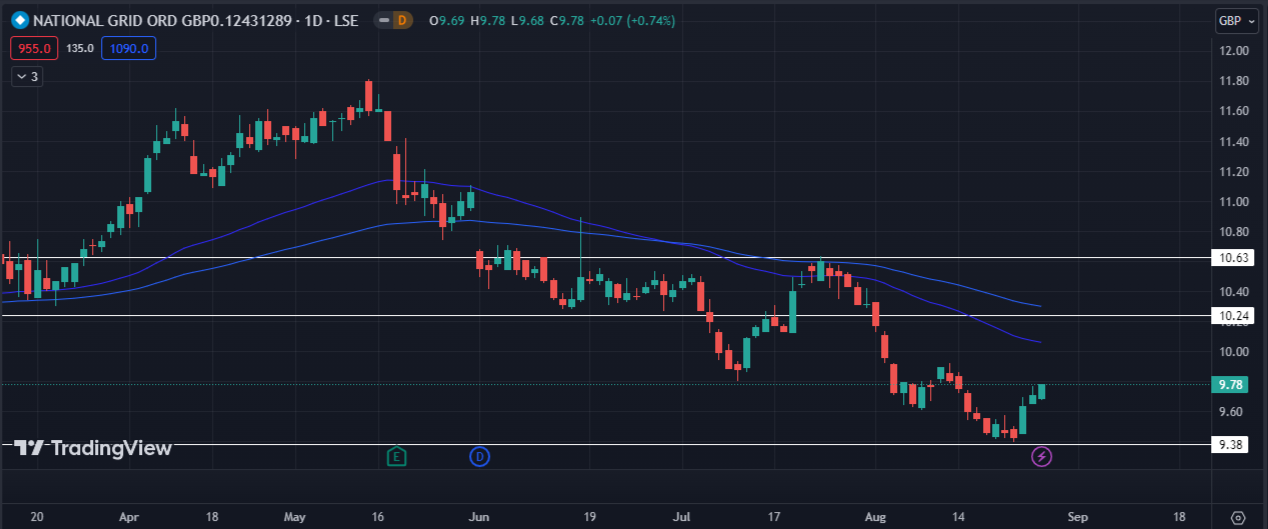
The National Grid stock faced a major rejection from its resistance at £10.63. It led the stock down to yearly low levels at £9.38. A sharp buying was seen as soon as the stock hit its support at £9.38, showing how strong those levels are. Currently, the chances of the stock going below this level look highly low. Buyers are dominating the stock as of now.
The stock on its daily closing gave a strong bullish candle, which also gave confirmation for a further up move. £10.24 acts as the next resistance and the first target from the current levels.
If we see the stock’s previous data, we will find that the range between 10.24£ and 10.63£ has been very strong. Thus, until the stock breaches the £10.63 level, you must not make a long entry.
Above that, if we still see a good bullish momentum, you can make a long entry in the stock with £11.8 as the target.
Even though a downside is very less likely to occur, £8.87 will act as a strong support. The stock will have to breach the 9.38£ level though!
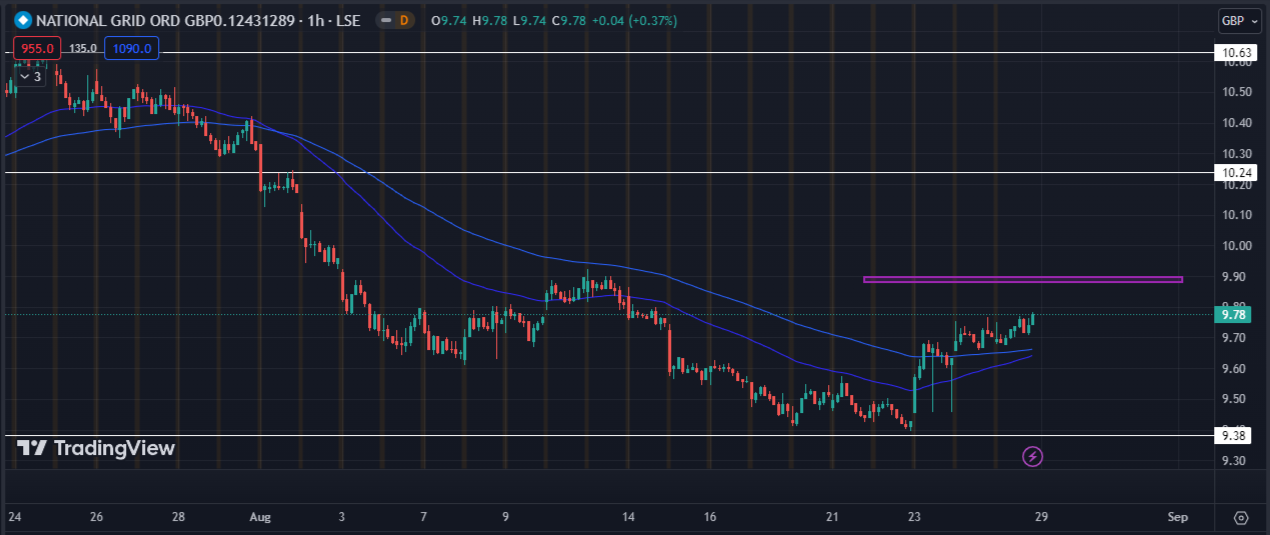
An hourly chart confirms the bullish momentum in the stock. The stock has been giving positive closing almost regularly since it hit its low. That’s a huge positive! £9.90 is a weak resistance ahead. If the stock crosses this, we can see £10.24 levels very soon.
50 and 100 EMA can support the stock which is a positive. We can expect a good upward move in the stock in the upcoming weeks. Traders should be highly alert to capture any move that comes.
Analysts on Tradingview predict the stock price to cross £16 in the next 1 year. That is a huge green flag for investors. One must wait for the stock to breach its zone before making an entry. There are fair chances that we might see a rejection from the £10.63 level because it is a highly strong resistance.
Conclusion:
The current setup looks pretty good. All the factors currently predict a bullish move in the stock in the upcoming weeks. Swing trades might enter long if the stock crosses £9.9 with small targets of £10.24 and £10.6. However, you must do proper research and analysis before making a move. People willing to enter for a longer term might want to wait for the stock to breach strong resistance levels!
Important technical levels:
Major support levels: 9.38£ followed by 8.87£.
Major resistance levels: 10.24£ followed by 10.63£.




