
 Covenant x402
 hi
hi Boomer
 Doge Pepe
 Claudia
 Quantus
 Pudgy Penguins
- Vertu Motors Plc stock is trading at 67.5 GBX.
- The price has been under the buyers’ control since October 2022 and it is still showing bullish sentiments.
Vertu Motors Plc (LSE: VTU) is a car dealer Group that was founded by Thomas Forrester on 1 November 2006. The company deals in the distribution and retail trade of automobiles.
Vertu Motors (VTU) Stock: Financial Analysis
Vertu Motors’ revenue in 2020 was around 2.55 Billion GBP. In 2021, the company generated revenue of 3.62 Billion GBP with a growth of 41.90% compared to the previous year. In 2022, it increased its revenue to 4.01 Billion GBP with a growth of 11.05%. Trailing twelve month (TTM) revenue for 2023 is running at 4.01 Billion GBP which is the same as the previous year’s revenue.
The net income of the company in 2020 was around 16.32 Million GBP and compared to its previous year, it showed a growth of 446.20%. In 2021, the company increased its net income to 60 Million GBP with a growth of 267.76% compared to the previous year. However, in 2022, the company only generated a net income of 25.53 Million GBP, which reflected a decline of 57.45%. The trailing twelve month (TTM) for 2023 is running at 25.53 Million GBP at the time of writing.
In 2021, the company managed to decrease its total debts but in 2022 its total debts increased to 237.80 Million from 144.81 Million.
The company has been able to gain consistent revenue over the years but the variables show that in 2022, the revenue had declined compared to its previous year.
Vertu Motors (VTU) Stock: Technical Analysis
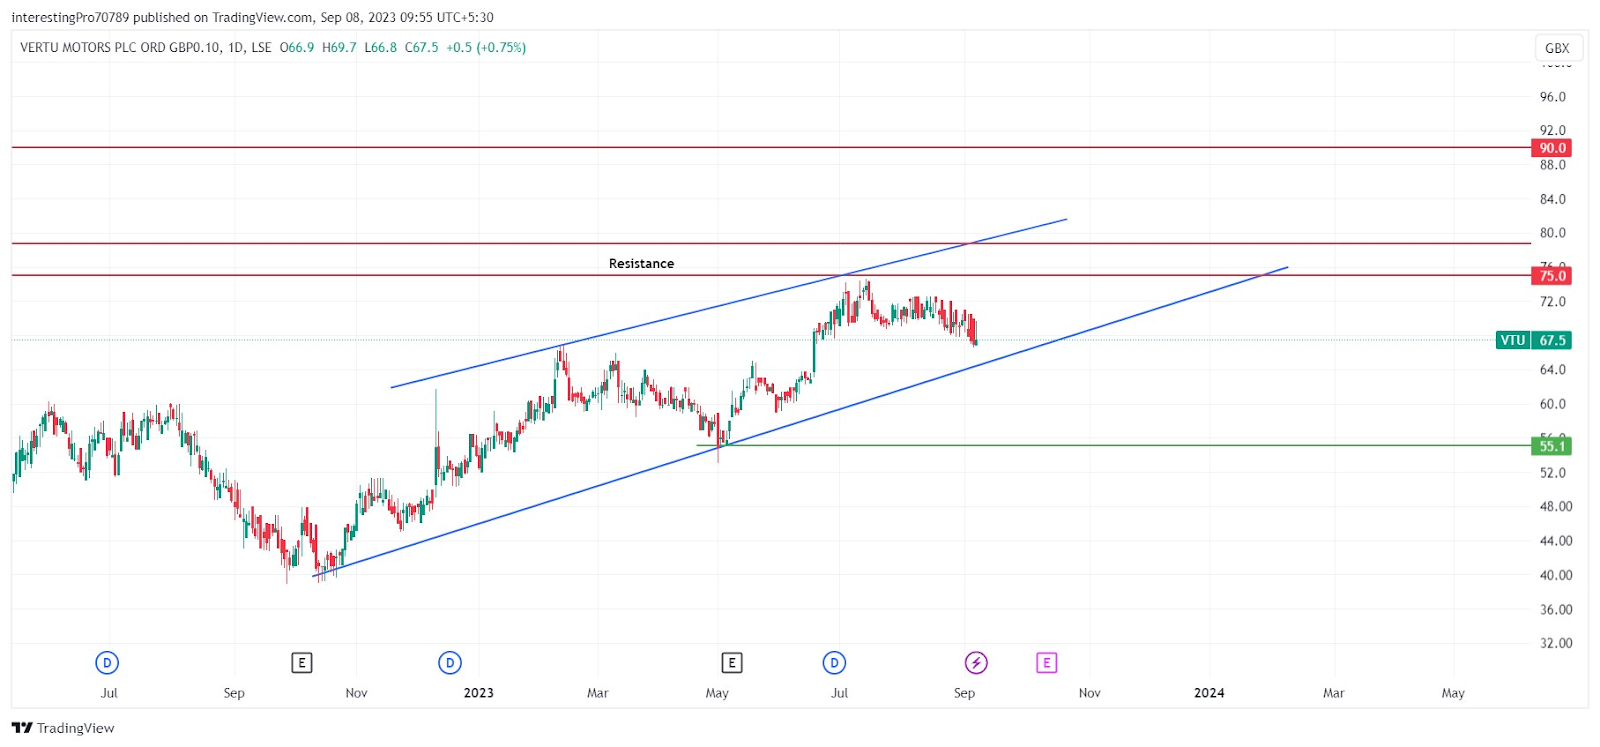
In 2022, the price formed support at 40 GBX and 46 GBX and commenced a strong bullish rally to 66.8 GBX. After reaching 66.8 GBX, the price faced rejection from there and started to fall. The price fell to 55 GBX and commenced a bullish rally from there. Afterward, the price was seen trading inside a rising parallel channel.
After commencing a bullish rally from 55 GBX, the price rose to the 75 GBX resistance level and faced rejection from there. The price is currently falling to the lower trendline of the parallel channel. If the price breaks below the parallel channel then it may fall to its next support at 55 GBX.
However, if the price took support from the lower trendline of the parallel channel and gave a breakout of the 75 GBX resistance. then it may rise to its first resistance at 78.8 GBX and then to its second resistance at 90 GBX.
Technical Indicators’ Prediction About the Current Trend
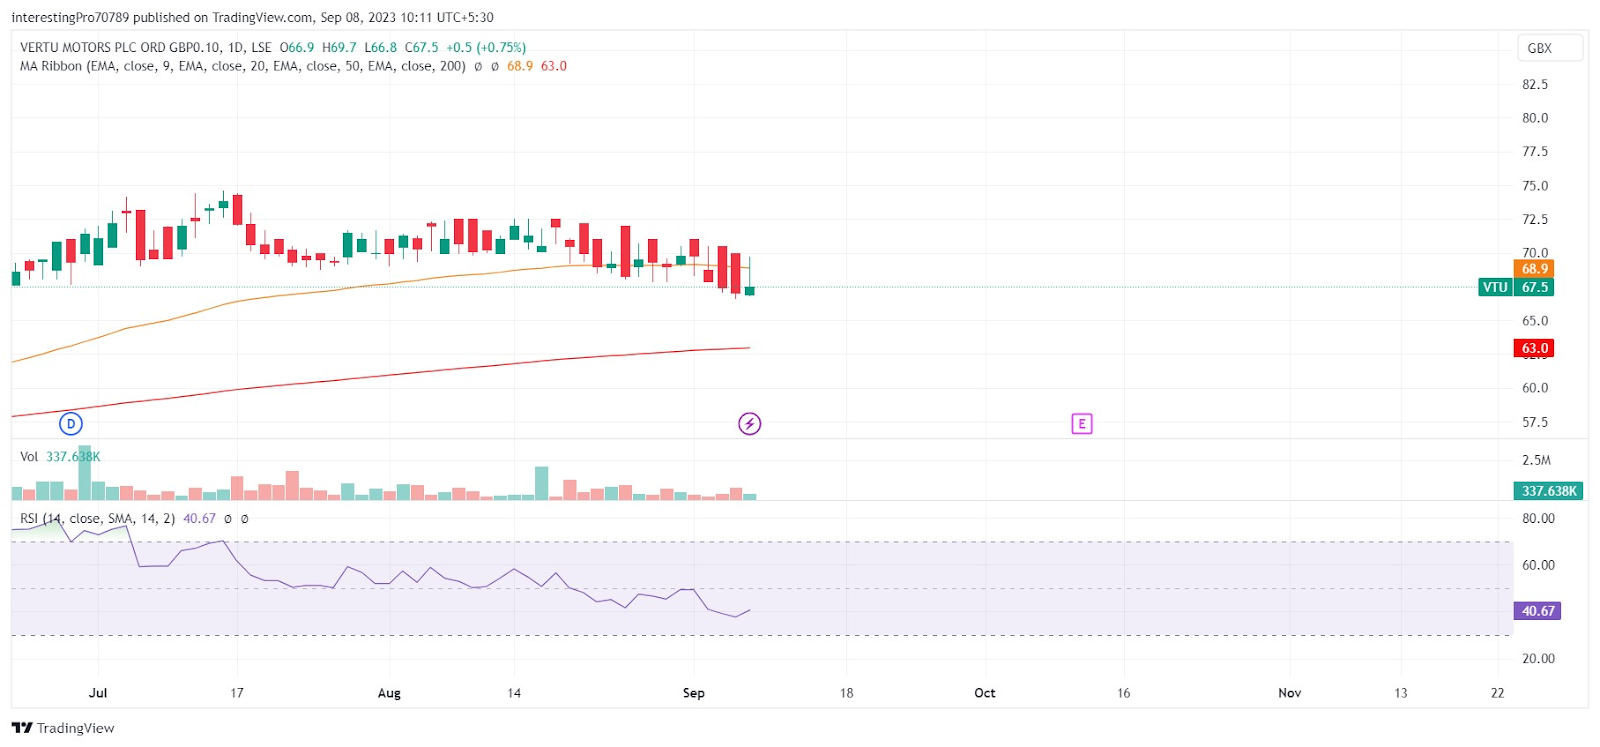
The price of VTU is trading between the 50 and 200 EMAs, which indicates the price taking pressure from both buyers and sellers.
The relative strength index (RSI) is at 40.67. The RSI line is in neutral territory at the time of writing which indicates the indecisive nature of the price.
Conclusion
The price of Vertu Motors is trading inside a parallel channel. The breakdown of the lower trendline of the parallel channel and the breakout of the 75 GBX resistance will decide the future price trend. The indicators mentioned above are neutral at the time of writing.
Technical levels
Resistance levels: 75 GBX, 78.8 GBX and 90 GBX
Support levels: 55 GBX.
Disclaimer
The views and opinions stated by the author, or any people named in this article, are for informational purposes only. They do not establish financial, investment, or other advice. Investing in or trading crypto assets comes with a risk of financial loss.




