
 Dacity Coin
 Celestia
 Quantus
 Bitcoin
 Pearl
Pearl Pons
Pons Injective
- The Rocket Companies stock has advanced by 1.35% in the last 24 hours.
- The RKT share breaks below the rising wedge pattern and it can result in a downtrend.
RKT Companies Inc. stock has an average trading volume of 1.99 Million. It has a total of 1.97 Billion shares trading in the market as of the year 2022. This company has a neutral ROA, ROE, and operating margin with a debt/equity ratio of 161.45%.
The current market cap of the company is $1 Billion and the 52-week trading range of the share is $5.97 to $11.95.
The market cap of the RKT share has advanced by 30.4% year-on-year as compared to Q2 2023. Its net income has shown a huge spike of 132.9%. The current EBITDA for the company is $246.13 Million following the second quarter of 2023.
The current ratio of the company is 1.46. It means that the company is capable enough to pay its debt following a gross profit margin ratio of 0.69.
Rocket Companies Inc. Performance Analysis
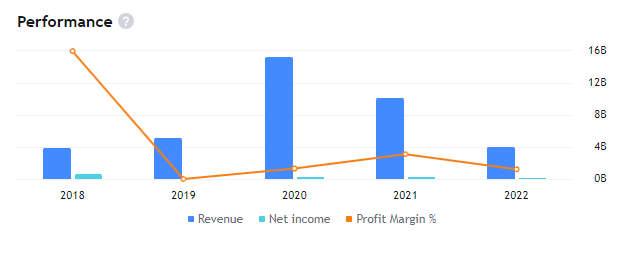
Rocket Companies has seen a consistent decline in its revenue from 2020. Its revenue has declined from $15.15B to $3.85B in 2022. The current net income of the company is just left by 1% following a gross profit of 98%.
RKT Technologies Technical Analysis
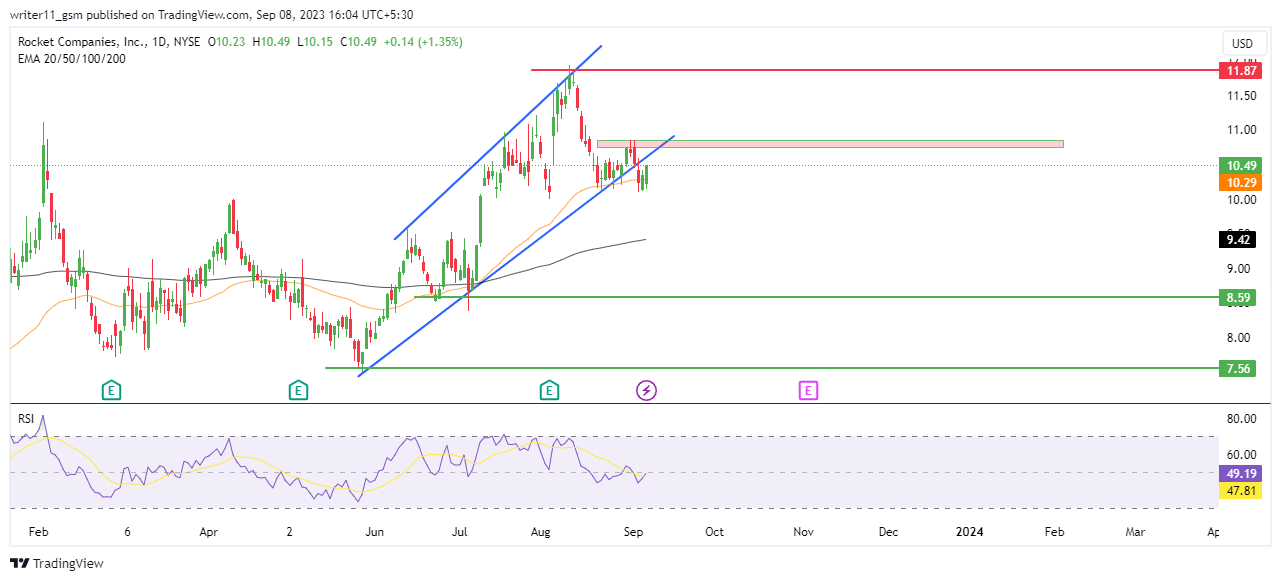
The RKT share price is trading in a downtrend as it is making lower low swings. It has recently broken down below the rising wedge pattern. However, this decline in price can also act as a liquidity grab if the price breaks above the previous swing high.
As the price has been consistently moving upward in the larger timeframe, the 50-day and the 200-day Exponential Moving Average has formed a golden cross. They are still trading in the same pattern, which is an indication of an uptrend.
The RSI for the RKT share is acting weak as it has declined below the level of 50. It has taken rejection from the overbought zones. If the price rebounds, then the RSI can again break above the 50 level and this can lead the market to the higher levels.
Technical Overview of RKT Stock
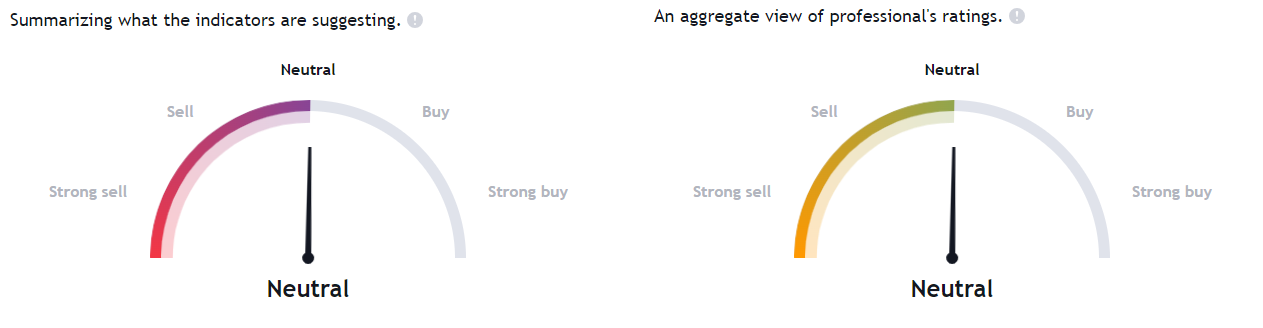
The stock price is untradeable as of now as the technical indicators and analysts are neutral on the share price.
Conclusion
The price of the RKT share has been consistently advancing from lower levels. It led to the formation of the rising wedge pattern and the price has broken below the level. If the market fails to break above the level of $11.00, we might see a very good decline in the price of the stock.
Technical Levels
- The support levels for RKT Stock are – $7.50 and $8.50
- The resistance levels for RKT stock are – $12.00 and $13.20
Disclaimer
The information provided in this article, including the views and opinions expressed by the author or any individuals mentioned, is intended for informational purposes only. It is important to note that the article does not provide financial or investment advice. Investing or trading in cryptocurrency assets carries inherent risks and can result in financial loss.




