
 Minter
 Quack AI
 NEAR Protocol
 Sui
Sui Hyperliquid
 Cardano
 Raydium
- TTOO price has been consistently declining from higher levels, leading to a decline of 95.27% in one year.
- T2 Biosystems has a market cap of 86.931 Million and 333.58 Million shares are floating in the market.
T2 Biosystems Inc. has a negative EPS of -5.7487 USD. That means that the company is making a loss of 5.7487 USD on its each share following a revenue of 22.305 Million. The company has an ROE of 143.81%, which indicates that the company is very good at converting its equity into profits.
The company works in health technology and specializes in vitro diagnostics. Its headquarters are situated in in Lexington. T2 Biosystems has a total of 158 employees. It was founded in 2006. The CEO of the company is John J. Sperzel.
The net cash at company has advanced by +21.7% year-on-year, resulting in $16.08 Million for Q2 2023. Its long-term debt has declined by -87.1%. However, the short-term debt has shown a huge advance of 4,177.0% ,resulting in $52.05 million. This advance in debt can either be positive or negative as the company might have taken the debt for new project execution.
T2 Biosystems Inc. Performance Analysis

The T2 Biosystems has a market cap of $101.208 Million out of which the revenue of the company is $13.202 Million. The company has a negative net income of -$52.43 Million and the valuation of the company has been consistently declining since 2018.
TTOO Stock Technical Analysis
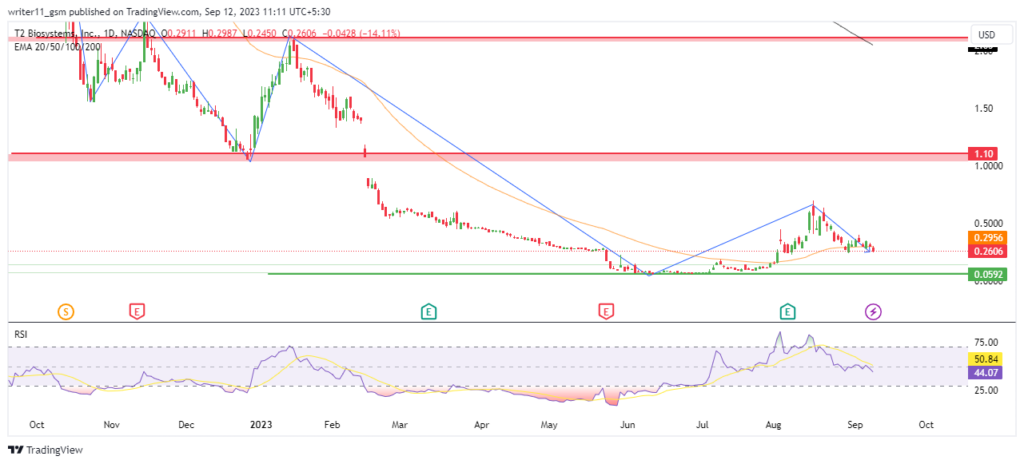
The price of the T2 Biosystems stock has been consistently declining from the higher levels since 2014. It has been consistently following the downtrend, making lower low swings. The share price is still negative and can decline to further lower levels.
As the price has been in a consistent downtrend, the 50-day and the 200-day Exponential Moving Averages have been following a death cross for a very long time. Both EMAs have expanded a lot to each other, which denotes the downtrend to be very strong. It indicates the share price can decline to further lower levels.
The RSI for the TTOO stock price recently broke out above the 50-level and hit the overbought zones. Yet, it could not sustain at the level and dropped below the 50-level, which indicates weakness on the charts.
Technical Overview of T2 Biosystems Inc. Stock
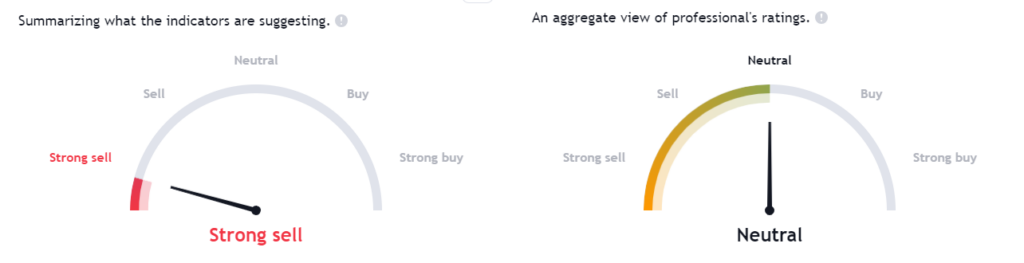
As per the data provided on TradingView, the majority of the technical indicators are negative on the charts, including Oscillators and the EMAs. The experts are neutral on the stock as there is no significant change in the fundamentals of the stock.
Conclusion
The T2 Biosystems Stock price has been consistently declining from higher levels leading to a strong downtrend in the market. The EMA’s and the RSI are also bearish due to the stock’s downtrend. Consistent sell-offs in the market indicate the presence of sellers in the market. The fundamental data of the stock is also weak. Therefore, the TTOO share price may decline further to the lower levels.
Technical Levels
- The support levels for TTOO Stock are – $0.5900 and $0.400
- The resistance levels for TTOO stock are – $1.10 and $2.10
Disclaimer
The information provided in this article, including the views and opinions expressed by the author or any individuals mentioned, is intended for informational purposes only. It is important to note that the article does not provide financial or investment advice. Investing or trading in cryptocurrency assets carries inherent risks and can result in financial loss.




