
 Dacity Coin
 Celestia
 Quantus
 Bitcoin
 Pearl
Pearl Pons
Pons Injective
- The stock has been in consolidation since March of last year.
- The RSI and MACD are in a downtrend and they have made a bearish crossover. Look at the levels in the article
- UNH stock price has seen bearish momentum in recent times as the EMAs have made a bearish crossover.
UnitedHealth Group Inc (NYSE: UNH) engages in the provision of health care coverage, software, and data consultancy services. Its share price is currently at a level of $480.
Fundamentally, the company has generated regular growth in revenue over the years. In the last quarter, the healthcare company reported its total revenue as $93 Billion. With an operating margin of 8.6%, the earnings before interest and taxes (EBIT) came up to $8 Billion. The net income after the tax provisions came to a level of $5.4 Billion.
Along with the year-on-year growth, the company was growing quarter-on-quarter as well, during 2022. The average quarterly growth was around 12% which has increased to 14% in 2023. Along with this, the company is giving regular dividends to its shareholders. The average dividend payout ratio is around 30% and it makes up a dividend yield of 1.2% on the share price.
Technical analysis and price prediction of UNH stock
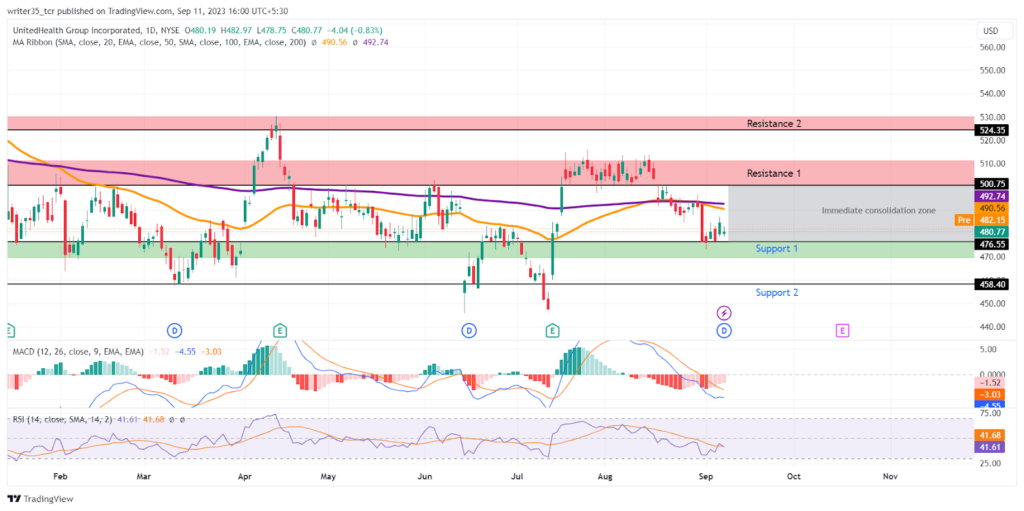
As for the technicals, the UNH stock price has been in a sideways but slightly bearish trend since November 2022. At the time of writing, the stock is seen at a price of $480 after crashing down from its exponential moving averages. However, there was a relief for the bulls when the UNH stock price bounced off its immediate support level of $476.
On the other hand, the first immediate resistance for the bulls will be $500 if the UNH stock price makes another high. However, beyond these immediate levels, the second support and resistance levels are at $458 and $524, respectively.
Furthermore, the 50 EMA made a bearish crossover with the 200 EMA back in January of this year. At present, the 50 EMA is at $490 while the 200 EMA is at $492. These are close to each other, which means that another bullish crossover is possible.
The MACD is showing a downtrend, as a result of a bearish crossover with its EMA back in the start of August 2023. At present, the MACD line is at the level of -4.5 while its EMA is up above at a level of -3.03
The relative strength index (RSI) is at a neutral territory of 41. The RSI line is seen coming down from touching its oversold levels of 66 back in July this year.
Conclusion
The UNH stock price prediction will be bullish if the bulls can push past the 50 EMA. This will result in this stock price moving toward its immediate resistance. Otherwise, a strong bearish momentum can be seen if the bears reject the uptrend at the 50 EMA.
Technical Levels
Support:$476, $458
Resistance: $500, $524
Disclaimer
The views and opinions stated by the author, or any people named in this article, are for informational purposes only. They do not establish financial, investment, or other advice. Investing in or trading crypto assets comes with a risk of financial loss.




