
 Quantus
 Pearl
Pearl Quack AI
 Starknet
 NEAR Protocol
 Zcash
Zcash Aerodrome Finance
- NEE stock is trading at $66.83.
- The price has recently given the breakdown of the $69.70 support level.
- NEE stock has been trading with a volume of 7.519 Million in the last trading session.
NextEra Energy, Inc. (NYSE: NEE) was founded on 28 December 1925. It is an electric utility company that deals in the provision of renewable energy.
NextEra Energy, Inc. (NEE) Stock: Financial Analysis
NextEra Energy, Inc.’s revenue in 2020 was around $17.08 Billion. In 2021, the company managed to increase its revenue to $21.27 Billion with a growth of 24.54% compared to the previous year. In 2022, the company generated $26.60 Billion in revenue, which showed a growth of 25.06%. The firm’s trailing twelve-month revenue for 2023 is running at $22.76 Billion, which is lower than the previous year.
The company has shown consistent growth in its net income over the last three years. In 2020, it generated a net income of $2.92 Billion, whereas in 2021 it showed a growth of 2240% with $3.57 Billion in its net income. In 2022, the firm increased its net income to $4.15 Billion with a growth of 16.06% compared to the previous year. The company’s trailing twelve-month net income is running at $8.10 Billion which is more than the previous year.
The company has paid consistent dividends to its shareholders with an average of 86.58 dividend payout ratio. The earnings per share (EPS) has also increased each year from 2020 to 2023.
Overall, the company has been very consistent in its financial growth with a very good dividend payout ratio over the last three years.
NextEra Energy, Inc. (NEE) Stock: Technical Analysis
In October 2022, the stock price formed support at $63.83 and initiated a bullish rally to $88.61. After reaching there, the price started facing rejection. The price managed a slight pullback and tried to go up to $86.47 and made the 2023 year-high.
After making the year-high, the price faced rejection from the trendline and started to fall back to its $69.70 support zone. The buyers stepped in at the support and pushed the price in the upward direction. However, after reaching $79.78, the price faced rejection from the trendline.
Subsequently, the price started to trade in a narrow parallel channel for almost 3 months. At the end of July 2023, the price gave the breakout of the parallel channel and went to $76.27 and faced immediate rejection from there. Subsequently, the price started to fall back to its $69.70 support zone.
In August 2023, the price gave the breakdown of the $69.70 support level and is trading below it. As long as the price stays below $69.70, it may continue its fall to the $63.98 support level and then to the next support at $59.51. However, for the price to gain bullish momentum, it must reclaim the $69.70 support level, after which it may rise to its resistance at $76.00.
Technical Indicators’ Prediction About the Current Trend
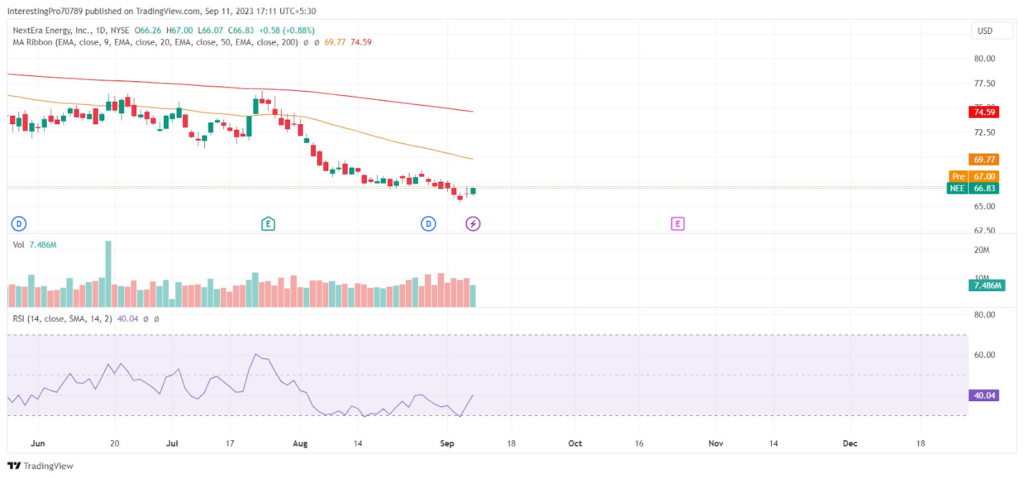
The NEE stock price is trading below the 50 and 200 EMAs, which indicates the bearish sentiment over the price.
The relative strength index (RSI) is at 40.04. The RSI is in bearish territory indicating that the NEE price is being controlled by the sellers at the time of writing.
Conclusion
The NEE stock price is witnessing bearish sentiments as of right now. The price has given the breakdown of the $69.70 support level and is trading below it. If the price stays below $69.70, then it may continue its fall to the $63.98 support level and then to the next support at $59.51. However, for the price to gain bullish momentum, it must reclaim the $69.70 support level, after which it may rise toward its resistance at $76.00.
Technical levels
Resistance levels: $69.70 and 76.00.
Support levels: $69.70, $63.98 and $59.51.
Disclaimer
The views and opinions stated by the author, or any people named in this article, are for informational purposes only. They do not establish financial, investment, or other advice. Investing or trading comes with a risk of financial loss.




