
 Pearl
Pearl Walrus
 Bitway
 Bitcoin
 Quantus
 Quant
Quant Pudgy Penguins
- The WTI stock price has surged by 2.44% in a week and 2.94% in a month but declined by 33.54% in a year.
- WTI’s price is trading below the 50 and 100 Exponential Moving Averages.
- W&T Offshore’s revenue has surged by 60.98% in 2021 and 65.05% in 2022.
Market capital of WTI – $615.219 Million
The current Market price of WTI – $4.20
The WTI Stock Overview
The price of the stock in the previous session of 19 September was up by $0.04, a rise of 0.96%. The stock has surged over 2.44% in a week and 2.94% in a month. It shows that the price is in an uptrend in the short horizon. The buyers are more aggressive and trying their best to move the price upwards.
The stock price has corrected over 54% from its 52-week high price. It shows that the stock has witnessed strong selling pressure from its high. Although the price seems like forming a base near the bottom level or we can say a 52-week low level. WTI’s price has increased slightly in a channel from the base.
The revenue of the company has risen significantly in two years as the revenue has jumped by 60.98% and 65.05% respectively in 2021 and 2022, the net income of the company has turned positive this time as the company generated a total loss of $41.48 Million in 2021 and in 2022 generated a profit of $231.15 Million.
The net debt of the company has been declining over the years. The net debt in 2016 was $950.49 million which is now standing at $239.82 Million. The best thing about the net debt aspect of the company is that the net debt has fallen over 74.82 % in 6 years. That is a very good sign for any company.
Technical Analysis of the WTI Stock:
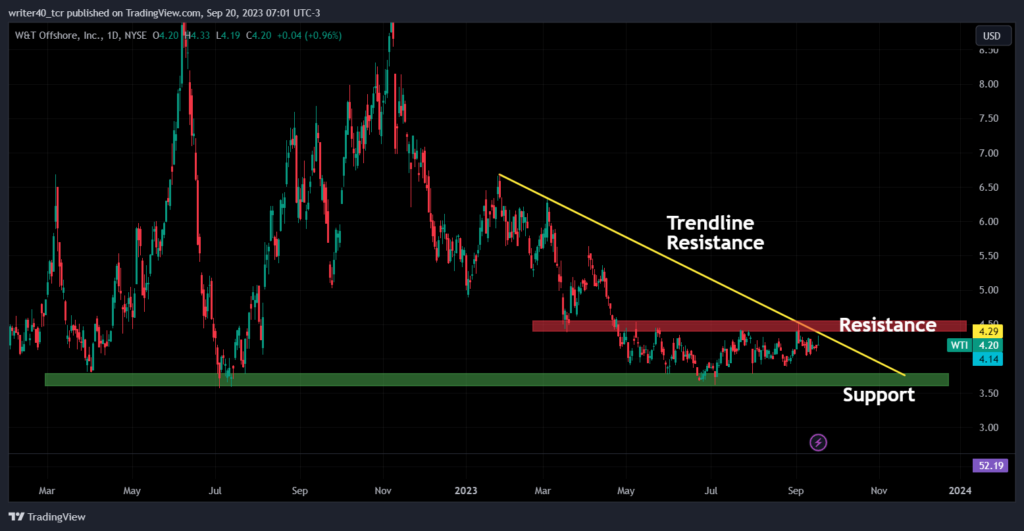
The price has formed a descending triangle pattern as drawn in the chart. Currently, the price is trading near the resistance level of the descending triangle pattern. It is very close to the horizontal resistance, which is present near the $4.40 and $4.52. The price has been consolidating since April 2023.
The price, although slightly rising upwards where the support is also rising slowly. The support is near the previous year’s low which the stock created in July 2022 i.e. between $3.6 and $3.7 levels.
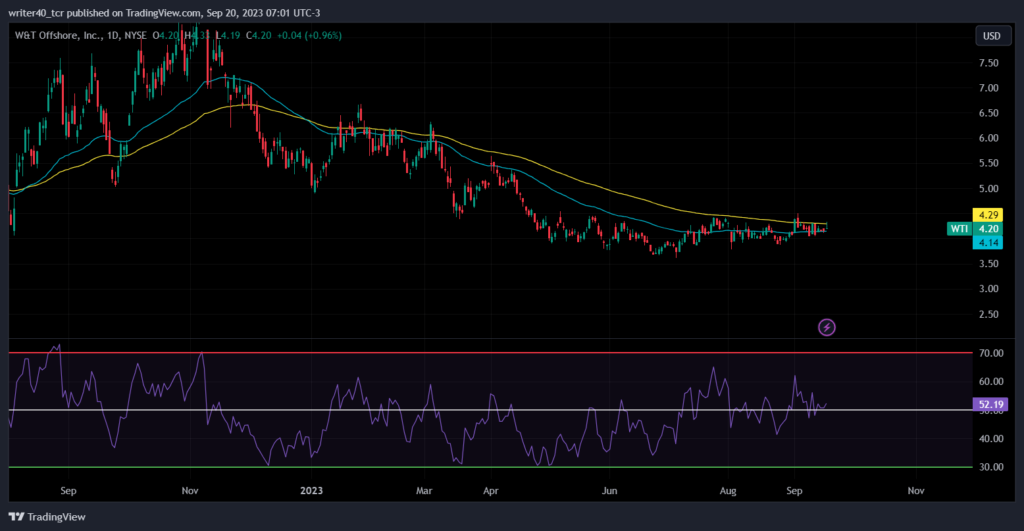
The price is trading below both the important Exponential Moving Averages of 50 and 100 which are currently present near $4.14 and $4.29. The slope of EMAs is now flat, which indicates and confirms the statement that the price is currently consolidating in a tight range of $4.5 and $3.6.
The price is facing rejection from the 100 EMA levels for the third time. It is a sign the sellers are taking 100 EMA as a base for selling. The Relative Strength Index is currently placed near 52.19. That means the price is gaining some momentum on the bull’s side.
Conclusion
WTI stock’s price seems to form a base at the bottom levels, but the price is facing some rejection from the 50 and 100 EMA levels. The Relative Strength Index (RSI) is also above 50 which indicates that the momentum is on the bull side. The financials are improving now which can boost the price from this level.
So if the price breaks the resistance level of $4.50 then it can try to challenge the seller’s present near the level of $5.4
Technical Levels:
Resistance – $4.5 and $5.4
Support – $3.60 and $2.97
Disclaimer
The views and opinions stated by the author, or any people named in this article, are for informational purposes only. They do not establish financial, investment, or other advice. Investing in or trading crypto assets comes with a risk of financial loss.



