
 Quack AI
 Lighter
 Pudgy Penguins
 Bittensor
 Solana
 Aptos
Aptos Quantus
- The stock price has surged by 18.98% in a week but declined by 3.55% in a month, and 81.37% in a year.
- LUMN share’s price is currently trading below the 50 and 100 Exponential Moving Averages.
- The revenue of the company has been declining for 3 years and the net income has been very unsteady over the years.
Market capital of Lumen Technologies – $1.643 Billion
Current Market Price of Lumen Technologies- $1.63
Lumen Technologies Stock Overview
The price of Lumen Technologies in the previous trading session of 19 September was up by $0.11 i.e. a rise of 7.24%, indicating that the price was under the control of the bulls. The price has surged over 18.96% in a week. It shows that the bulls are slowly taking control of their hands and are trying to pull the price up.
Lumen Technologies’s price has seen a decline of 3.55 % in a month and 81.37% in a year. It indicates that the price is in a strong downtrend as the decline of 81.37% in a year is not ordinary. The decline is indicating some serious problems going on in this company.
The company’s revenue has been declining for the last, 3 years which is a matter of concern for the company, as the pace of declining is increasing every year. If we talk about the net income of the company, it has declined over 176% in previous results. The firm posted an overall loss which is also a bad sign for the company.
The net debt of the company has been declining over the years indicating that the company is doing some corrective action required to reduce the overall debt on the company. Lumen technology has paid a decent dividend over the years. The dividend yield of the company is 14.37%, which is the highest since 2016.
Technical Analysis of Lumen Technologies
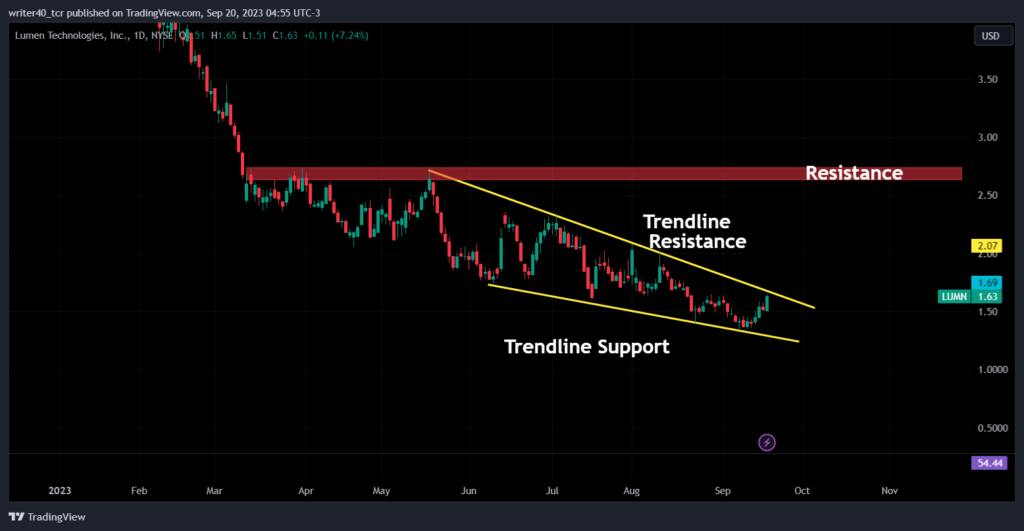
The stock price has formed a falling wedge pattern on a daily time frame and the price is currently trading very close to its resistance level i.e. Trendline Resistance. The price has risen from the support level beautifully and sharply. It confirms that the active buyers are taking positions near the support levels.
The resistance of the pattern is present near the price of $1.68, which is restricting the price from going up. The trendline is also providing support to the price and is currently present near $1.30. If we talk about horizontal resistance, then the next crucial resistance is present near the area of $2.68 and $.2.72.
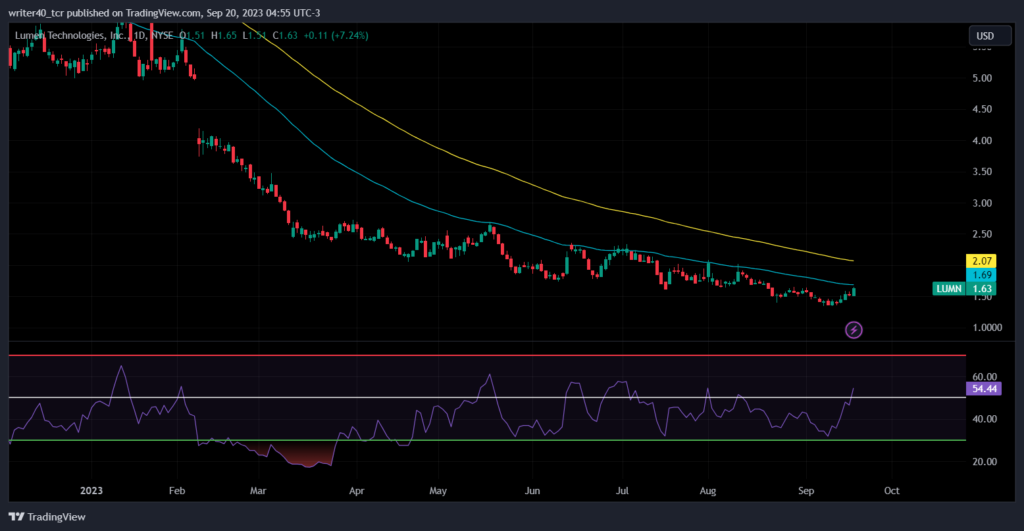
The price of Lumen Technologies is trading below both the important Exponential Moving Averages i.e. 50 and 100. The EMAs are present near the level of $1.69 and $2.07, which will provide some necessary resistance to the price. The slope of EMAs is downward which indicates the strong bearishness in the stock.
The LUMN stock price is facing a rejection from the 50 EMA as visible on the chart. The price has faced rejection 5 times till now in a short period of time indicating that the 50 EMA is a very strong hurdle to cross for the stock. Rsi of the stock is currently present at 54.44 levels which indicates that the bullish momentum is still going on in the stock.
Conclusion
As the price is trading near EMAs and the falling wedge pattern’s resistance, the price can try to break the levels. The RSI is looking positive and price action is also confirming the same. So, if the price breaks the level on the upside, then the price will try to achieve the level of $2.7.
The support for the price is present near $1.35 i.e. previous swing low and the lower trendline will act as support in the future too.
Technical Levels
Resistance – $1.68 and $2.70
Support – $1.38 and $1.29
Disclaimer
The views and opinions stated by the author, or any people named in this article, are for informational purposes only. They do not establish financial, investment, or other advice. Investing in or trading crypto assets comes with a risk of financial loss.




