
 Boomer
 Minter
 Pearl
Pearl Pudgy Penguins
 Sui
Sui Covenant x402
 Pump.fun
- The EDV Price faced a decline of 1.45% since the last trading day.
- Currently, the company stock price is trading at 1635 GBX.
Endeavour Mining (EDV) H1 2023 Financial Performance Report
The business reported total sales of $1,005.3 million in the H1 2023 report, which was considerably less than the same period in 2022.
In the H1 2023 report, earnings before taxes were reported at $207.2 million, which was down from the same period in 2022.
In H1 2023, earnings per share (EPS), including basic and diluted EPS, were recorded at 0.31, which declined from 0.48 compared to the H1 2022 report.
The company earned $369.2 million from Mining operations in the first half of 2023 which declined compared to its previous H1 2022 report.
In comparison to the previous H1 2022 report, the company’s balance sheet and its cash and cash equivalents both showed a fall.
In the first half of 2022, the debt ratio was 0.48, and it is currently 0.50 which increased and could impact the company’s growth.
This shows the company’s earning for the first half of the year 2023 is comparatively lower than the previous first half of the year 2022.
Endeavour Mining Plc
EDV’s market capitalization is around 4.126 Billion GBP and trades with an average volume of 766.594K. Currently, the stock price is trading at GBX and has faced a decline of 1.21% since the last trading session. The trading volume was about 182.425K in the last trading day.
Technical Analysis on Endeavour Mining Stock.
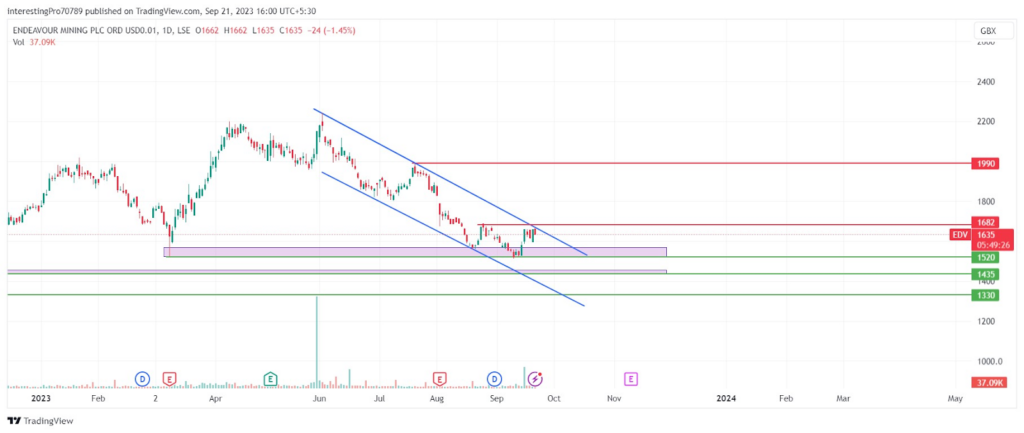
The EDV price formed a strong bullish candle in the last trading session near its support zone. The price surged up to 3.83%. In the longer timeframe, the price has been trading inside a parallel channel after creating its year-high of 2242 GBX.
Talking about the levels 1520 GBX level is acting as a strong support level from where the price initiated a bullish rally of almost 30.79% previously. The 1682 GBX level could be considered as resistance as the price has faced rejection which is also the recent made by the price. The price is trading in a narrow range of 1520 GBX to 1682 GBX.
The price could be seen consolidating between these two levels in the upcoming trading days because after breaking its low of 1556 GBX the selling pressure was not strong. The buyers started to influence the price as the price was trading near its 1520 GBX support.
Currently, the price is trading in a parallel channel and is sustaining above its 1520 GBX support. So now if the price breaks above the 1639 GBX then it may price up to its next resistance at 1990 GBX. However, for the price to continue its downtrend it must close below 1520 GBX support then it may to its next support at 1435 GBX.
Technical Indicators on the Current Trend
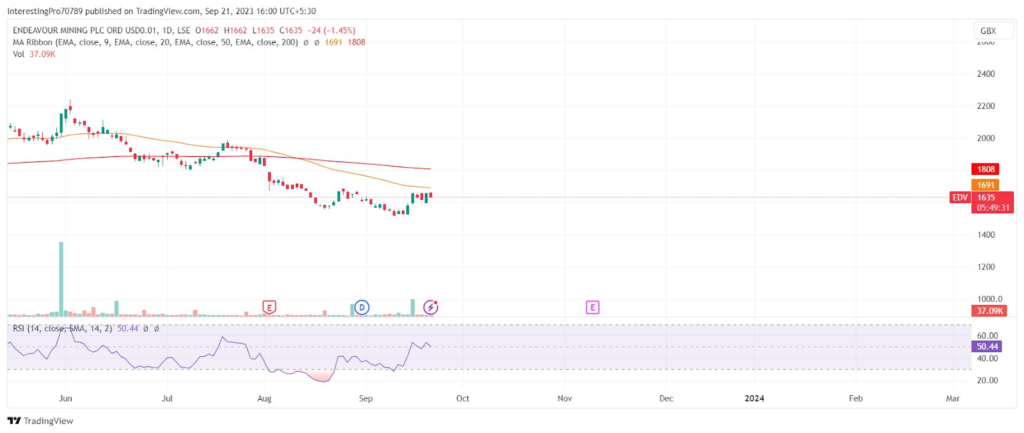
The EDV price is trading the below 50 and 200 ema lines indicating the selling pressure and bears control over it.
The relative strength index is at 50.84. The RSI line is in neutral territory indicating the price is being pressurized by sellers as well as buyers.
Conclusion
The overall chart of Endeavour Mining is bearish as the price is continuously falling from its year high of 2242 GBX. Currently, the price is trading inside a range of 1520 GBX to 1639 GBX. The buyer’s presence can also be seen as the price is making strong bullish candles near 1520 GBX support. if the price breaks above the 1639 GBX then it may price up to its next resistance at 1990 GBX. However, for the price to continue its downtrend it must close below 1520 GBX support then it may to its next support at 1435 GBX.
The Financial reports have shown a decline in its first half of earnings compared to its previous year’s earnings.
Technical levels
Resistance levels: 1639 GBX and 1990 GBX.
Support levels: 1520 GBX and 1435 GBX.
Disclaimer
The views and opinions stated by the author or any other person named in this article are for informational purposes only. They do not provide financial, investment, or other advice. Investing in or trading in the stock market comes with a risk of financial loss.




