
 Minter
 Bittensor
 Hyperliquid
 NEAR Protocol
 Monero
 Pearl
Pearl Quantus
- The ZIM share price has started to surge since JP Morgan went bullish on the stock.
- ZIM Integrated Shipping Services Ltd’s share price has been consistently declining for the last six months.
ZIM Integrated Shipping Services Ltd offers container shipping and cargo services across the globe. It is among the top 20 global carriers and has a legacy of more than 70 years. ZIM Integrated was established in 1945 as the ZIM Palestine Navigation Company Ltd., by the Jewish Agency, the Israel Maritime League, and the Histadrut (the main labor union in Israel). Its mission is to reimagine energy for people and the planet and achieve net zero emissions by 2050 or sooner.
ZIM Integrated Shipping Services has a gross margin of 27.47%. This means that it retains 27.47% of its revenue after paying the cost of goods sold. This firm’s earnings per share (EPS) is 10.81. That shows the firm makes $10.81 for each share it has issued. Its market cap has declined by -73.7 year-over-year, reaching 1.49 Billion in Q2 2023. This firm has net cash of 1.04 Billion which is 9.9% higher than the previous quarter’s result.
ZIM stock is currently priced at $11.00. The company has a total value of $1.322 Billion, based on the market price of its 120.184 Million outstanding shares. The average trading volume of the stock is 2.543 Million. The stock’s beta is 1.35, which means that it is more sensitive to market fluctuations than the average stock.
ZIM Integrated Shipping Services Performance Analysis
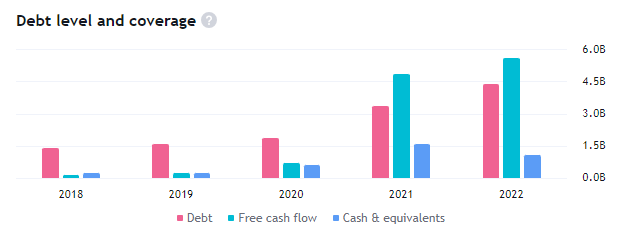
ZIM Integrated Shipping Services has earned $12.56 Billion in revenue in 2022. The company’s revenue increased by $1.83 Billion in comparison to the previous year. The company’s net income dropped slightly to $4.62 Billion, with a profit margin of 36.77%. The company also has a debt of $5.54 Billion and the free cash flow has improved compared to 2021.
ZIM Share Technical Analysis
a by writer11_gsm on TradingView.com
The JP Morgan stock is falling from higher levels, making lower highs in a downtrend. This stock is trading within a descending wedge pattern and the price may keep dropping as it is forming bearish candlesticks.
It is below the 50-day and the 200-day Exponential Moving Averages (EMA) after a bearish EMA crossover on the charts. It signals a downward trend in the market.
The RSI is at 30 and has fallen below the oversold levels. It has not reached the overbought zone since then, which shows that the buyers have not been able to gain momentum for the beginning of an uptrend. It suggests a downward trend in the market.
Technical Overview of ZIM Stock
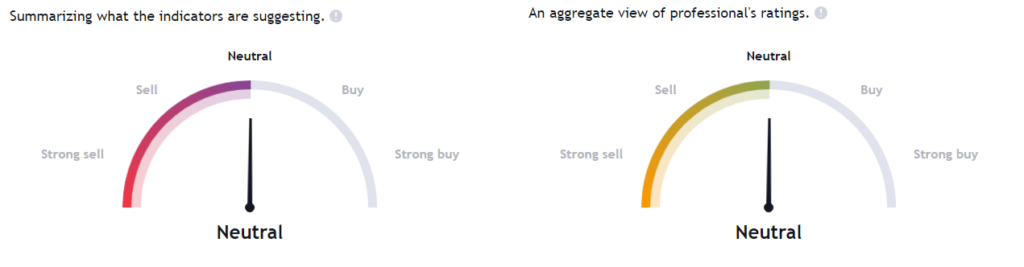
The stock’s technicals are negative on the daily timeframe with various indicators such as multiple moving averages and oscillators indicating a bearish trend.
Conclusion
The JP Morgan stock price is on a downward trend and it is trapped in a descending wedge pattern. This stock’s price is forming a negative candlestick pattern on the daily timeframe. Indicators like the EMAs and the RSI are also suggesting a bearish trend as the price has declined to much lower levels.
The share price may keep falling to lower levels unless it can break out of the descending wedge pattern.
Technical Levels
- Support levels for the ZIM share are – $5.00 and $8.00
- Resistance levels for the ZIM share are – $ 15.50 and $22.00
Disclaimer
The information provided in this article, including the views and opinions expressed by the author or any individuals mentioned, is intended for informational purposes only. It is important to note that the article does not provide financial or investment advice. Investing or trading in cryptocurrency assets carries inherent risks and can result in financial loss.




