
 streamoors
 IGNITION
 NEAR Protocol
 Injective
 Pearl
Pearl LayerZero
 Quantus
- The price of the token is forming a bullish flag pattern in the weekly timeframe.
- It is currently trading at $42.75 with an increase of 0.30% in the last 1 day.
- The token is down from its all-time high by only 27.21%.
The token marked its all-time high on 18th Feb 2023 where the token was priced at $58.46. The token could make a new high this year because the price is currently creating a bullish flag pattern from where the price will shoot up.
The token is currently trading with a rise in the trading volume by 38.97% in the last 24 hours. The current market cap of the token is $2.55 Billion. It has a current circulating supply of 60.00 Million OKB which is only 20% of the total supply and the 24-hour trading volume of the token is $2.07 Million.
Only 20% of the total supply is currently circulating in the market. As soon as more tokens are in the circulating supply and the daily trading volume increases, we can expect the token to make another all-time high this year.
Sentiment Analysis
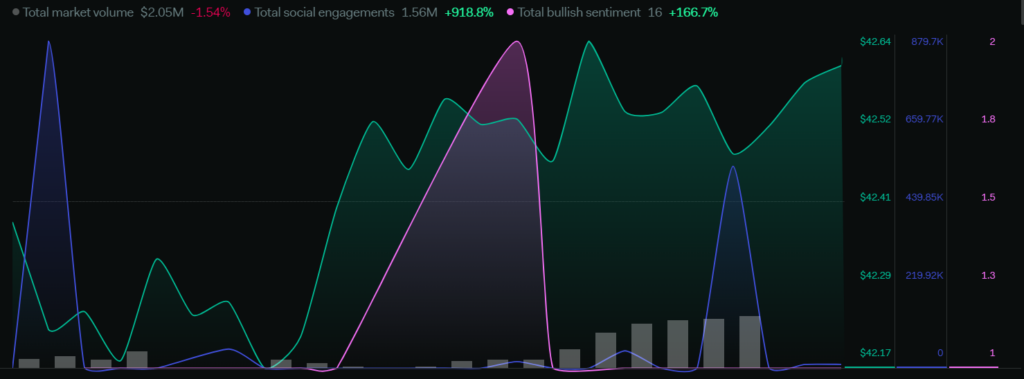
The total market volume of the token has decreased by 1.54%. The total social engagements have surged by 918.8% which shows that the social community is currently engaging and active on social platforms. The total bullish sentiments have increased by 166.7% which shows that the investors are bullish about the price.

The bearish sentiments also surged by 300% which shows that the price may also fall from the bottom of the bullish flag pattern and if the price breaks down from the retracement level of the bullish flag, then we can see a downtrend in the token.
Technical Analysis ( Weekly- 7D )
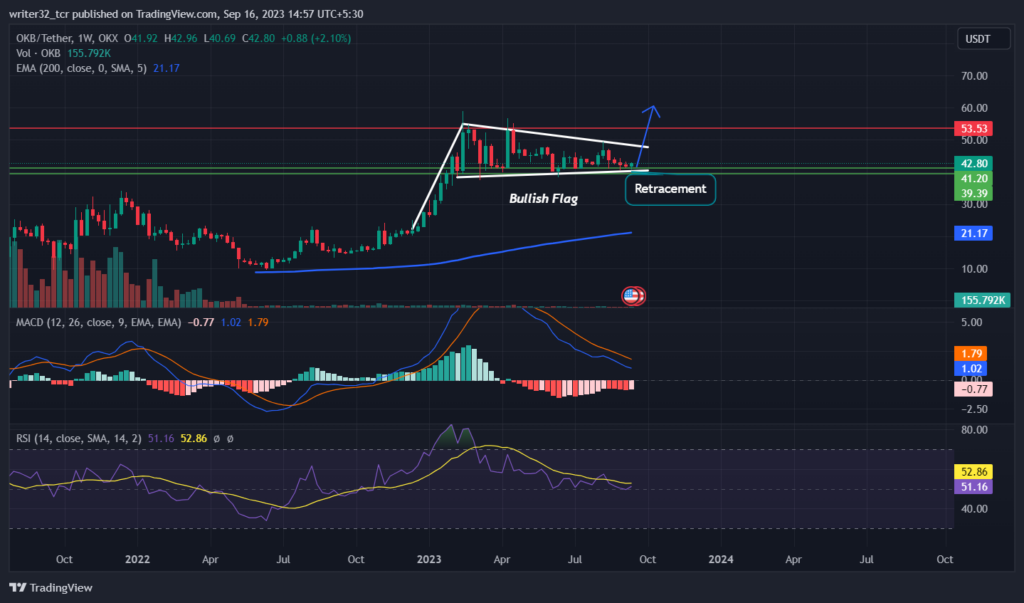
As we can see in the chart, the price is currently in an uptrend and is forming a bullish flag pattern. The price is currently at the retracement level. It is also making a green candle which shows the positive signs for bullish movement in the price action. If the price breaks above from the bullish flag patterns, then it can easily break the all-time high.
On the other hand, if the price breaks below the bottom of the bullish flag, then it could be the beginning of a downtrend for the token. It might then fall to the price level of $31.4.
What the Indicators Say
The RSI is currently at 51.16 points which shows that the price is above the neutral level. The RSI level above 70 points will confirm the strong buying of the token and this will also confirm the bullish movement.
If the price starts falling below the neutral levels and enters the oversold region below the RSI level 30, then we can confirm the downtrend in the price of the token.
Coming to the MACD, the blue fast line MA is moving below the red slow line MA. Both the MAs are above the average level zero. Currently, the MAs are indicating a bearish move as the fast line MA is moving below the slow line MA and the volume in the histogram is indicating a decrease in the volume levels.
However, If the blue fast line MA crosses above the red slow line MA and the volume starts to increase, then the uptrend will continue for the token.
The price has currently crossed above the 200-day EMA which is a bullish sign for the price.
DAILY CHART
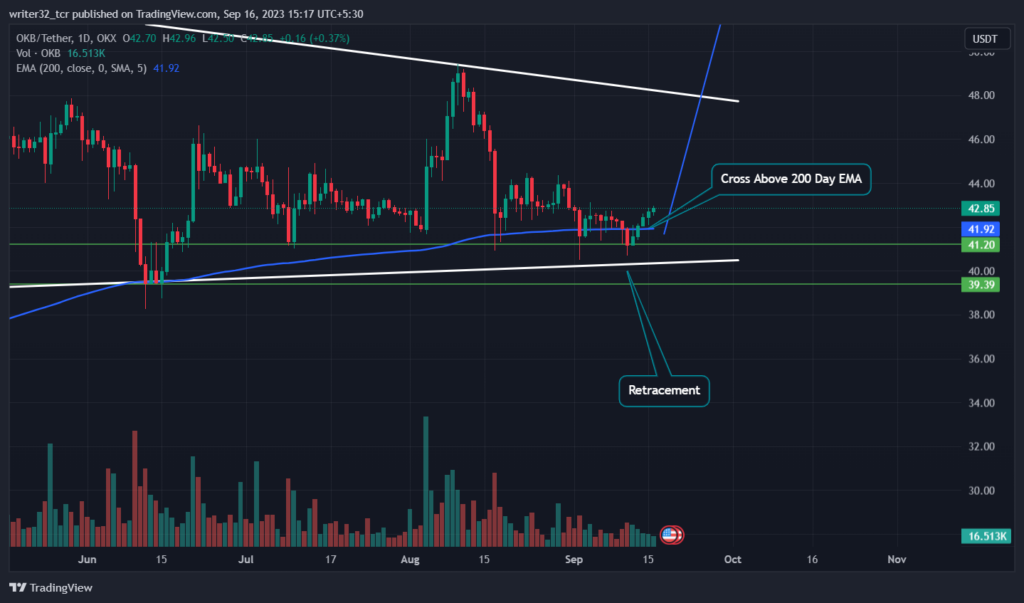
OKB LIVE CHART :
Conclusion
The price is currently in an uptrend and has also formed a bullish flag. The price has also crossed the 200-day EMA which shows that the price is bullish. The increase in the weekly volume and breakout above the bullish flag will confirm that the price will break the all-time high this year.
If the price gets rejected and it breaks below the bottom of the bullish flag and the support levels, then a downtrend will begin for the token.
TECHNICAL LEVELS :
SUPPORT : $39.3 AND $41.2
RESISTANCE : $49 AND $56
Disclaimer
The views and opinions stated by the author, or any people named in this article, are for informational purposes only and do not establish financial, investment, or other advice. Investing in or trading crypto assets comes with a risk of financial loss.




