
 Pearl
Pearl Ondo
Ondo Starknet
 Quantus
 Aerodrome Finance
 Pudgy Penguins
 Akash Network
- MKR is bullish in all-time frames.
- It is currently trading at $1271 with an intraday rise of 4.2%.
- The token is down from its all-time high by 80%.
The MKR token has been recording profits throughout the last year. The price of the token has increased by 93.18% in a year. The token is currently moving above the 200-Day EMA which shows the bullish movement in the price action.
It is currently trading with a surge of 50% in the trading volume the last 24 hours.
The token marked its all-time high on 4th May 2021 when it was priced at $6,339.
The token has a present market cap of $1.24Billion. It has a trading volume of $94.72 Million in the last 24 hours. The token has a current circulating supply of 977.63K MKR which makes up 97.22% of the total supply.
Sentiment Analysis
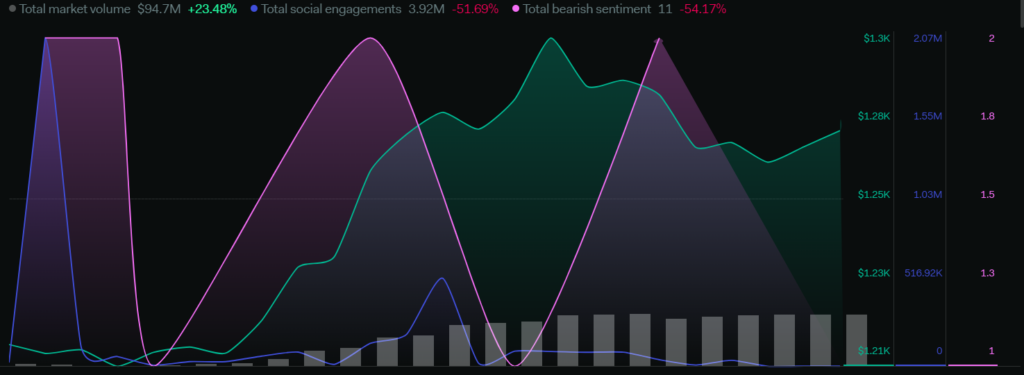
The total volume of the token has increased by 23.46% which shows that the bullish investors are currently investing and are active. The total social engagements declined by 51.69% which shows that the social community is not very active at the moment, the total bearish sentiments also decreased by 54.17%.
Technical Analysis ( Daily – 1D )
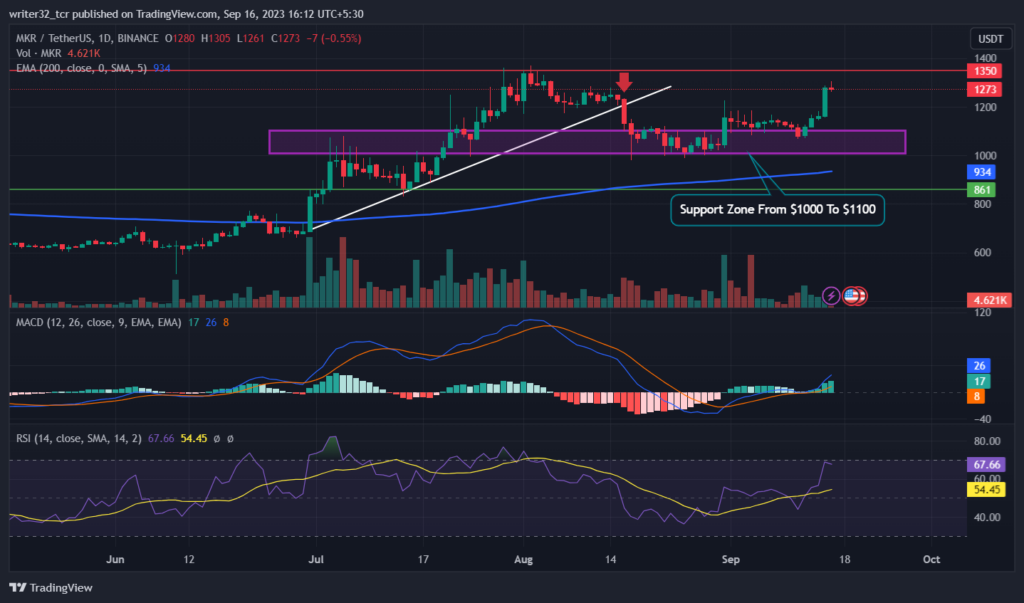
As we can see in the chart, the price started moving above the 200-day EMA on a bullish trendline and after sometime the price broke below the trendline and then fell to the support zone between $1000 and $1100 from where the price took support.The token is currently trading at $1273.
If the price breaks the $1350 resistance level, the next target will be $1580. If the price is rejected at the resistance level of $1350, then it will fall again to the support zone of $1000 and $1100, if the price breaks the support of $1000 and $1100 then, the next support level will be near $800.
What the Indicators Are Saying
The RSI is currently at 67.66 points which is above the neutral level of 50. The RSI will soon cross 70 points from where immense buying of the token will be seen. The move above 70 points will confirm the bullish price action.
Coming to the MACD, the fast blue line MA is moving above the red slow line MA. The fast line MA is also moving above the average level of zero. The volume is also getting increased in the histogram. The overall MACD is indicating signs of bullishness.
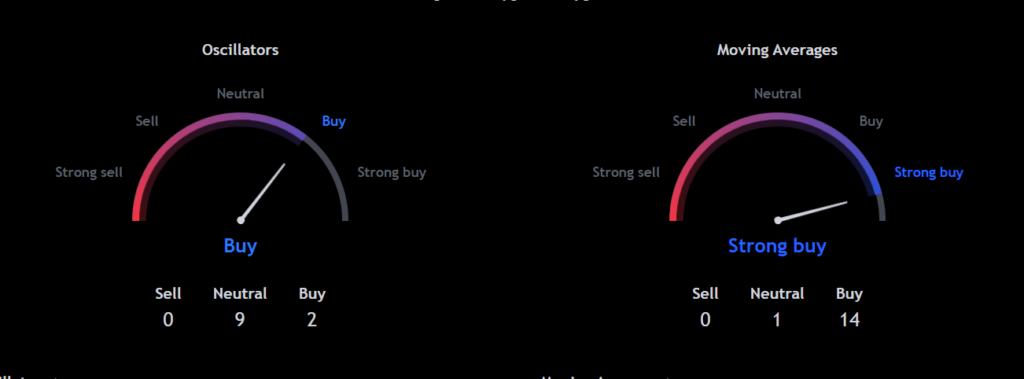
Currently, all the indicators and oscillators are giving strong signs of the bullish price action and we are likely to see further upward movement in the price in the upcoming days.
MKR LIVE CHART :
Conclusion
The overall analysis of the token shows that the price is currently under a bullish movement. All the indicators and patterns are showing signs of bullishness in every time frame.
Currently, as per the writer, there are no signs of bearish price action or of a downtrend.
However, this is not meant to be financial advice and you should always do your own research before making any investment.
Technical Analysis
Support: $1000 to $1100 and $800
Resistance: $1350
Disclaimer
The views and opinions stated by the author, or any people named in this article, are for informational purposes only and do not establish financial, investment, or other advice. Investing in or trading crypto assets comes with a risk of financial loss.




