
 Quack AI
 NEAR Protocol
 Pudgy Penguins
 Pearl
Pearl Quant
Quant Quantus
 Sui
Sui
- The net profit of the company has declined by over 14% in the previous financial report.
- Johnson and Johnson has been consolidating in a range for more than a year.
- The Relative Strength Index of the stock is at 40.92.
Market capital of the Johnson and Johnson – $386.486 Billion
The current market price of the Johnson And Johnson – $160.50
The JNJ Stock Overview
In the previous trading session, the stock ended with a decline of $1.16 or 0.72%. The stock has been trading flat for more than a year because it has declined by over 2% in a week and 3.25% in a month. The stock has declined by just 1.62% in a year signifies that the stock is trading flat over the years.
The revenue of the company has been rising slightly over the years. In 2016, the revenue of the company was $71.94 Billion which is now standing at $95.02 Billion. A rise of over 32% in 6 years which is positive but a little slow growth. The net profit of the company has declined by over 14.07% in the latest financial report.
The net debt of the company has risen to the highest level since 2016 as the net debt has surged to $17.44 Billion. The company was in a position of net cash surplus in 2016. The company is paying a dividend yield of over 2% over the last 6 years. In the last financial year, the company paid a dividend yield of 2.52%.
Technical Analysis of the Stock
The Johnson and Johnson stock’s price has formed a symmetrical triangle pattern. The resistance level for the pattern is present near the level of $175. If we talk about the support, it is present near the level of $157. The price is heading towards the support level and the support level has been tested 4 times till now.
if we observe the broader trend of the stock, the price is trading in a flat range. The upper level of the stock is near $178 and the lower level of the stock is near the level of $148.
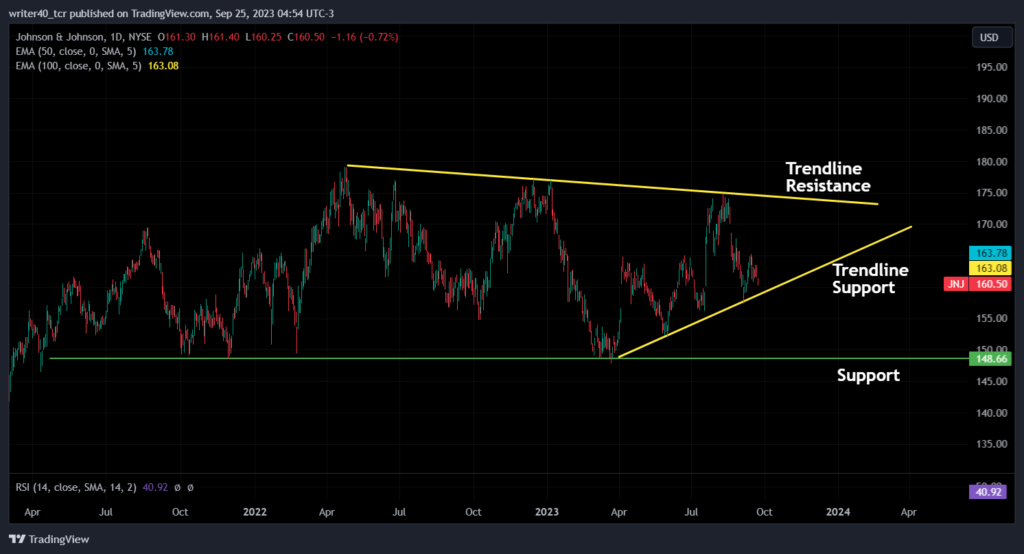
Price is facing resistance from 50-day and 100-day Exponential Moving Averages.
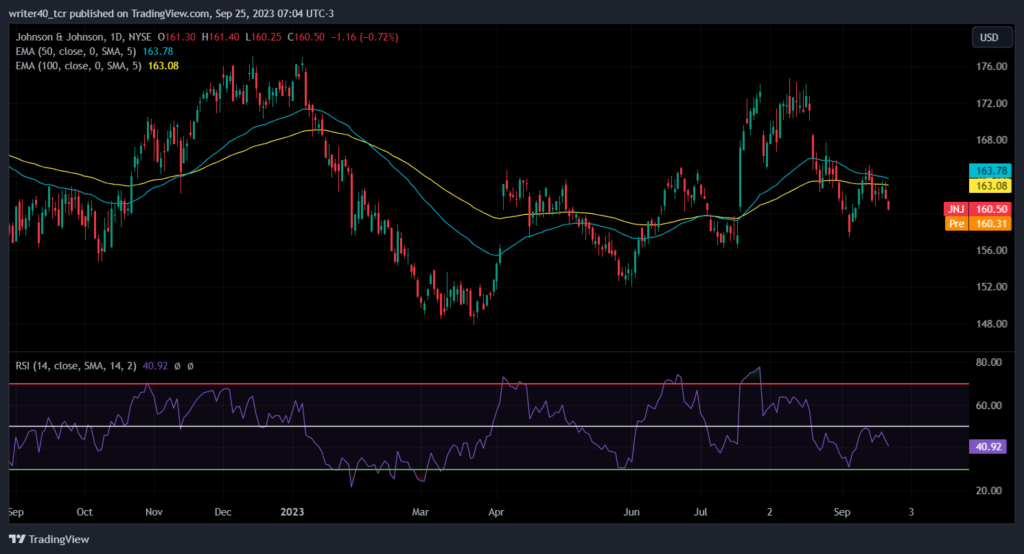
The 50-day and 100-day Exponential Moving Averages are trading flat. The price is trading below both the Exponential Moving Averages. Both the EMAs are present at $163.78 and $163.08 levels respectively. Relative Strength Index (RSI) is currently placed at 40.92. The slope of the RSI is downward which indicates that the buyers have lost momentum.
Conclusion
The JNJ stock has been consolidating for more than a year. The company has performed poorly in the last financial year. The expectation for this year also is not good so the stock can feel some pressure ahead.
If the company posts some surprises in its financial report, only it can show some rise. If the stock breaks the upper level of $178, we can say that the price can reach the $200 level. Suppose the price breaks the level of $148, it will unlock the lower level of $130.
Technical Levels
Resistance – $175 and $178
Support – $157 and $148
Disclaimer
The views and opinions stated by the author, or any people named in this article, are for informational purposes only. They do not establish financial, investment, or other advice. Investing in or trading crypto assets comes with a risk of financial loss.




