
 Bitcoin
 ZKsync
 Pudgy Penguins
 Pearl
Pearl Quantus
 Starknet
 NEAR Protocol
- Broadcom’s stock is trading above the 50-day and 100-day Exponential Moving Averages.
- This stock has surged by over 74% in a year.
- The revenue of the company has been rising significantly since 2016.
Market capital of the Broadcom’s Stock – $342.19 Billion
The current market price of the stock – $829.08
Broadcom Stock Summary
In the previous trading session on 22 September 2023, the stock jumped by $20.72 with a rise of 2.56%. The AVGO stock has surged for two consecutive trading days and closed the day in green, which signifies that the bulls are gaining some strength. Although the stock has declined by over 4% in a week and 8% in a month, the sellers have dominated the stock in the short term.
The stock has surged by over 74% in a year, which shows that the bulls are in control over the price on a broader horizon. However, the stock is consolidating in a range on upper levels. Its price has faced a rejection thrice near the level of $919. The stock has been witnessing some buying near the level of $800.
The company has performed well in its revenue aspect, as the revenue of the company has surged every year since 2016. Broadcom’s revenue in 2016 was $13.24 Billion which is now standing at $33.20 Billion in 2022. It witnessed a rise of over 150% in 6 years. The net income of the company is unsteady as it declined by over 77% in 2019 and then surged by over 320% in 3 years.
If we talk about the net debt of the company, it is currently at $27.56 Billion. However, in 3 years, the net debt has declined from $34.07 Billion to $27.56 Billion. Although the net debt has risen from $10.54 billion in 2016, an overall surge of over 160% in 6 years. The stock has paid a dividend yield of 3.47% in 2022 which is adequate.
Technical Analysis of the Stock
The stock is currently trading flat in a broader range of $800-$919 and has been consolidating for more than 3 months. The resistance zone for the stock is present near the levels of $910 – $919. If we talk about the support zone, then it is present near the levels of $778 – $768 and the second support zone is present near the level of $645 – $631.
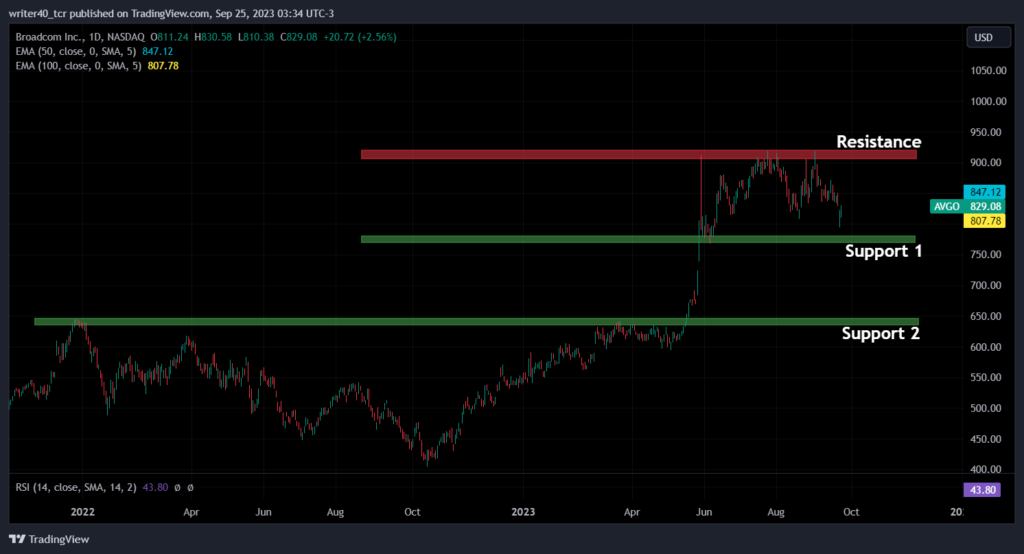
The 50-day and 100-day Exponential Moving averages are providing some essential support to the price.
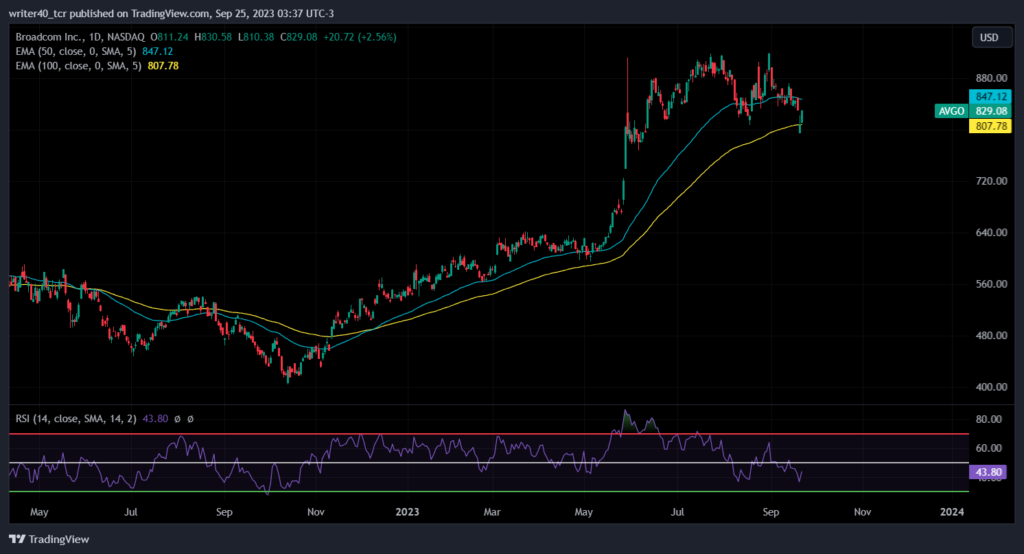
The stock is trading just above the 100-day Exponential Moving Average, which is a bullish sign for the stock as of now. The price has breached the 50-day EMA level and is trying to regain the 50 EMA. The Relative Strength Index (RSI) is currently below 50 and sloping downward. It states that the bulls have lost momentum and the momentum is now shifting towards bears.
Conclusion
The fundamentals of the stock are performing well and are expected to perform well in the upcoming financial report. The price of the stock is consolidating on the upper levels, which shows that the price is forming a base. If the price breaks the lower level of $767, it can try to retest the breakout level of $645.
Technical Levels
Resistance – $910-$919
Support – $778- $768
Disclaimer
The views and opinions stated by the author, or any people named in this article, are for informational purposes only. They do not establish financial, investment, or other advice. Investing in or trading crypto assets comes with a risk of financial loss.



