
 Quantus
 Injective
 Bitcoin
 Quant
Quant Pudgy Penguins
 Raydium
 Bittensor
- GEL stock is currently trading at $10.46.
- The GEL stock price has gained around 4.18% since the last trading session.
Genesis Energy LP (NYSE: GEL) is a US-based company that produces natural gas and crude oil and provides services to crude oil and natural gas producers and industrial and commercial enterprises.
Genesis Energy LP (GEL) Stock: Technical Analysis
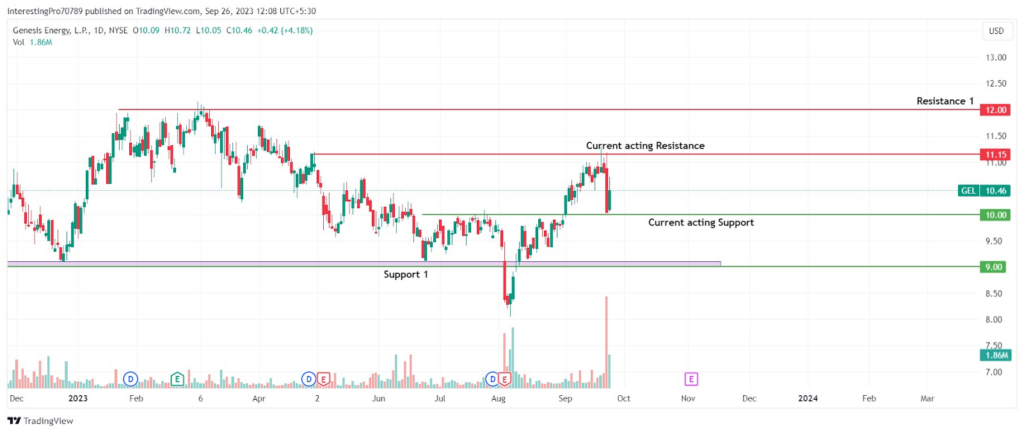
In the 1-day chart of GEL, we can observe that the price is witnessing bullish sentiments after it reclaimed the $9 support level. The price has also given a breakout of $10 which caused it to be stuck in a narrow range between $9 to $10. After reclaiming the $9 support level, the price has gained a 14.90% surge till now since the last 30 trading sessions.
The price is currently sustaining above the $10.00 level and it has found support at this level after facing rejection from the $11.15 level. The price is trading inside a range between $11.15 and $10.
GEL price is pointing towards the bullish sentiment on the GEL chart. If the price closes above the recent high of $11.15, then it may rise to its next resistance level at $12. However, for the price to gain bearish momentum, it must give a breakdown of the $10 support level after which it may fall back again to its $9.00 support level.
Technical Indicators On the Current Trend
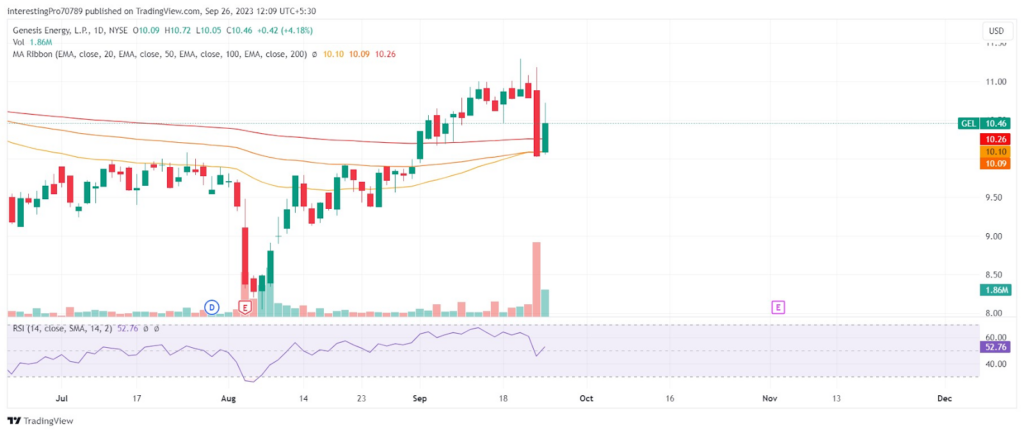
In the last trading session, the price pierced above the 50, 100, and 200-day exponential moving averages (EMA). The price is currently trading above all the EMAs, indicating the buyers’ domination over the price.
The relative strength index (RSI) is at 52.76. The RSI line has started to slope in the upward direction after taking support from the 50-RSI level. This shows that the buyers have shown their presence at the current level. This indicates that the price has bullish momentum and the RSI trending in the upward direction shows that there is more room for buyers to raise the price.
In the last two trading sessions, the volume bar has reached higher than the previous volume bar. This shows the strength of the price movement in these two trading sessions.
Conclusion
The technical analysis and technical indicators are pointing toward bullish dominance in the upcoming trading sessions. The analysts are also giving a buy signal in the current scenario. For the price to continue its bullish rally, it must close above $11.15, after which it will rise to $12. However, for the price to gain bearish momentum, it must give a breakdown of the $10 support level after which it may fall back again to its $9 support level.
Technical levels
Resistance Levels: $11.15 and $12.00.
Support Levels: $10.00 and $9.00.
Disclaimer
The views and opinions stated by the author or any other person named in this article are for informational purposes only. They do not provide financial, investment, or other advice. Investing in or trading crypto assets comes with a risk of financial loss.




