
 IGNITION
 streamoors
 Injective
 NEAR Protocol
 Pearl
Pearl LayerZero
 Quantus
- The BILI stock price is currently at $13.43 with a decline of 1.16%.
- The company’s stock chart reflects the sellers’ control over the price.
Bilibili Inc. (NASDAQ: BILI) is an advertisement company that provides a platform for its users to upload, view, and add overlaid commentary on videos. The company also deals in the provision of online entertainment content.
Why Did the BILI Stock Price Fall?
On Monday, 25 September 2023, the Bilibili share price faced a decline of 2.2% in the afternoon session. The shares of several Chinese stocks were affected due to the ongoing concern about the country’s property sectors.
Bilibili generates a major portion of its revenue via advertisements. The economic uncertainty stemming from the property sector can lead to reduced consumer spending on advertisements. This could have directly impacted BILI’s financial growth.
Bilibili Inc. (BILI) Stock: Technical Analysis
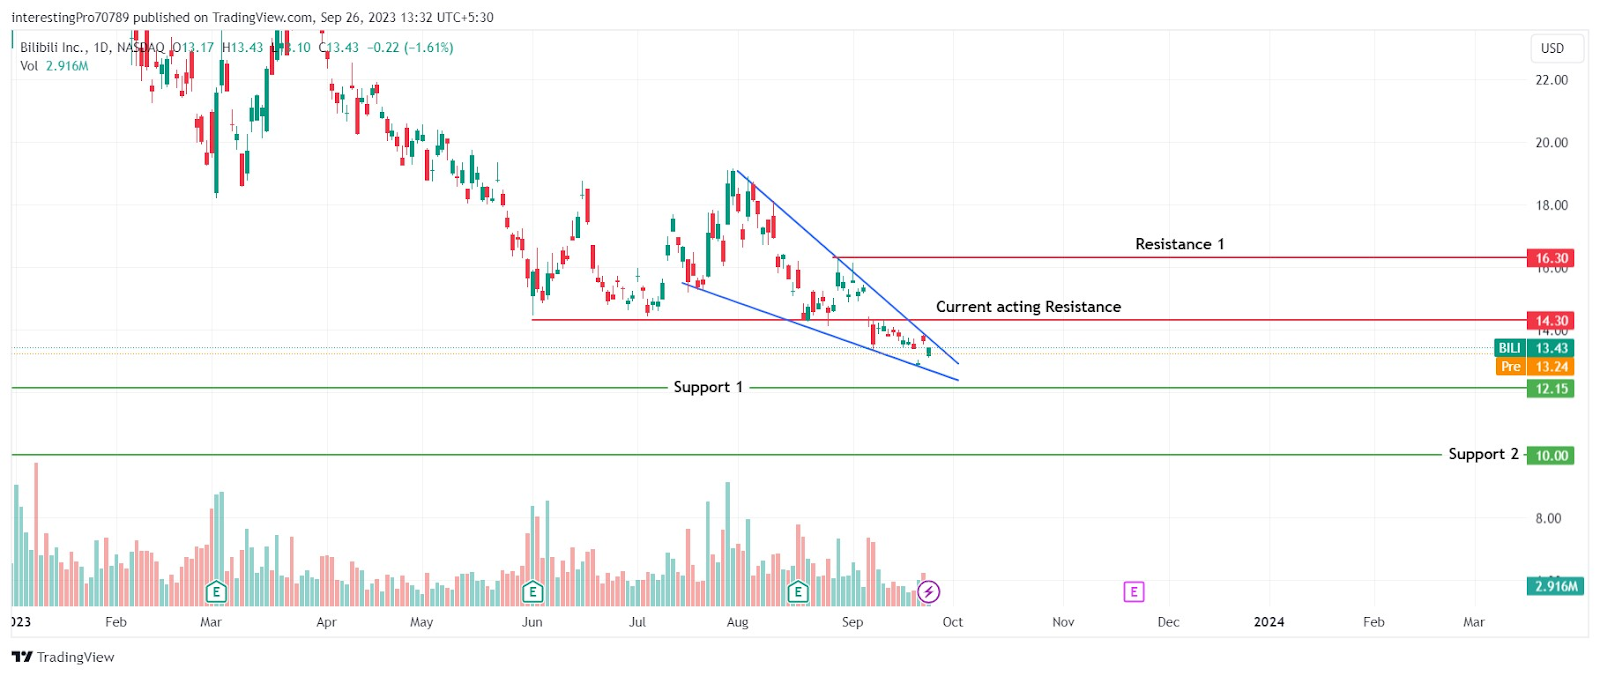
While monitoring the 1-day chart of BILI. It seems that the company’s stock price has been in a continuous downtrend since it created its 2023-year high at $29.46. The price can also be observed trading inside a falling wedge pattern. Recently, the price has given the breakdown of its $14.30 support level and is currently trading below it.
The BILI stock price has faced a decline of 1.16% since the last trading session and is approaching its historical support at $12.15. Previously, a bullish rally was initiated from the $12.15 support level. History could be repeated and another bullish rally could begin from this support level.
If the price initiates a bullish rally after taking support from the $12.15 support level, it could reclaim the $14.30 level. Then the price can move on to reach its resistance level at $16.30. However, it will be difficult for the price to rise above the $16.30 resistance level as the company’s finances are not great at the moment.
If the price breaks below the $12.15 support level, then it can continue its fall to the next support level at $10.00.
Technical Indicators On the Current Trend
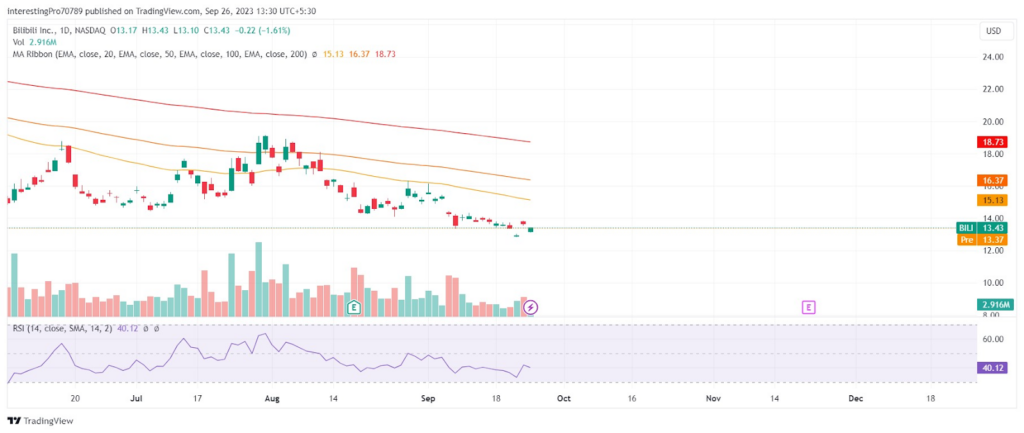
The BILI stock price is currently below every major exponential moving average like the 50,100 and 200-day EMAs. This indicates that the price is currently experiencing bearish sentiments and is under the control of sellers at the time of writing.
The relative strength index is at 40.12. The RSI is in bearish territory with the RSI line sloping in a downward direction, inviting more sellers as there is room for the price to fall.
The volume bar has not shown any spike in the last 10 trading sessions, indicating the weakness in the movement of the price.
Conclusion
The overall chart of BILI stock is bearish as the price is continuously falling. stock price has recently given the breakdown of the $14.30 support level and is trading below it. The price is approaching its historical support from where the bullish rally had been initiated before. The price could be seen repeating the history and if so, it could go on to reclaim the $14.30 level. Then it may rise to its resistance at $16.30.
On the other hand, for the price to continue its bearish trend it should close below $12.15 after which it can fall to its next support at $10.00.
Technical levels
Resistance Levels: $11.15 and $12.00.
Support Levels: $10.00 and $9.00.
Disclaimer
The views and opinions stated by the author or any other person named in this article are for informational purposes only. They do not provide financial, investment, or other advice. Investing in or trading comes with a risk of financial loss.



