
 Minter
 Quack AI
 NEAR Protocol
 Pearl
Pearl Monero
 Pons
Pons Sui
Sui
- Cemtrex Inc. has witnessed a net loss of $13.02 Million in the financial year of 2022.
- The revenue of the company has surged by over 16% in the last financial report.
- The price of the stock has surged by over 16% in a week.
Market capital of the CTEX’s stock – $5.601 Million
The Current Market Price of the CTEX’s stock – $5.61
CETX Stock Overview
The CETX stock’s price declined massively in the recent trading session of 25 September. The stock price has declined by $0.89 with a fall of over 13% intraday. Yet, the price of the stock has surged by over 16% in a week. It states that the buyers are trying to push the price up from this level. The price has escalated by just 2% in a month but declined by over 27% in a year.
The revenue of the company has declined tremendously over the years. The revenue of the company was $93.70 Million in 2016. It jumped to $120.3 Million in 2017. Now, in 2022, the revenue of the company is standing at $50.27 Million. A decline of over 58% since 2017, which is not a good sign for the company. The net profit has also declined from a profit of $4.99 Million in 2016 to a net loss of $13.02 Million in 2022.
The net debt of the company has declined over the years. In 2016, the net debt of the company was $17.90 Million. It is now standing at $9.70 Million in 2022. It is a good sign for the company, but the decline in the overall financial tally of the company is alarming. The company has not paid any dividends since 2017, which indicates that this stock is not a good option for dividend-seeking investors.
Technical Analysis of the CTEX Stock
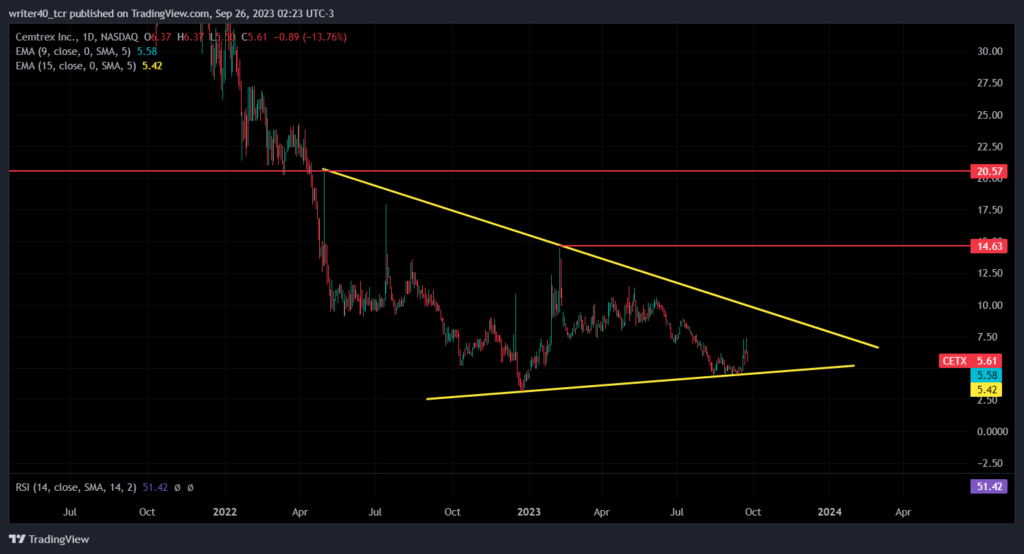
The price is facing a rejection near the previous swing low of $7.28. The stock price has tried to cross the level but failed to do so. It has formed a strong base near the level of $4.40 as the price has spent some time there. After forming a base, the price has crossed the resistance level of $6.21.
The stock has formed a symmetrical triangle pattern on the daily time frame and is trading very close to its support level. The resistance zone of the pattern is near the price of $9.67 and the support zone is near the $4.55 level. If we talk about the horizontal resistance for the price, it is present near the $14.63 level. The next resistance level is present near the price of $20.57.
Conclusion
If the price gives a breakout of the symmetrical triangle pattern on the upside, it can show some sustainable upward move. The price can face rejection near the $14.63 level and then near the level of $20.57. If the price breaks the level on the downside, it can take support near the price of $3.24 and then at the $3 level.
Technical Level
Resistance – $7.28 and $14.63
Support – $3.24 and $3
Disclaimer
The views and opinions stated by the author, or any people named in this article, are for informational purposes only. They do not establish financial, investment, or other advice. Investing in or trading crypto assets comes with a risk of financial loss.




