
 Bitcoin
 Ondo
Ondo NEAR Protocol
 Walrus
 Pearl
Pearl Pons
Pons Ethereum
- The GEOS stock price has surged massively by over 213% in a year.
- This stock’s price is trading above the 50-day and 100-day Exponential Moving Averages.
- The company has witnessed a massive jump in its revenue in recent quarters.
Market capital of the GEOS Stock – $180.287 Million
The current market price of GEOS Stock – $13.67
The GEOS Stock Summary
In the last trading session of 25th September, the stock price surged by $0.15 with a rise of 1.11%. Although if we observe the candlestick it seems to be a very bearish candle on the top of the trend. Token’s price has formed a shooting star candlestick, which indicates the price has exhausted and the sellers took control over the price in intraday.
The price of the stock has surged by over 17% in a week, 41% in a month, and 213% in a year. It indicates that the price is in a very strong uptrend and the buyers have dominated the price throughout the year. The latest candlestick created by the price can be an early indication of the fall and the price can react to it.
The company’s revenue has surged slightly since 2016. In 2016, the revenue of the company was $62.06 Million which jumped to $89.25 Million in 2022. The TTM revenue is showing a great jump as it is currently standing at $121.06 Million. It indicates that the company is performing very well in its revenue aspect.
This company has never posted a net profit in the last 6 years. The same thing can be observed on the chart, as the price was trading very low for the past 3-4 years. Although a good part of the company’s financial tally is that the company is in cash surplus. The company is able to repay its debt if the management decides to do so.
Technical Analysis of the GEOS Stock
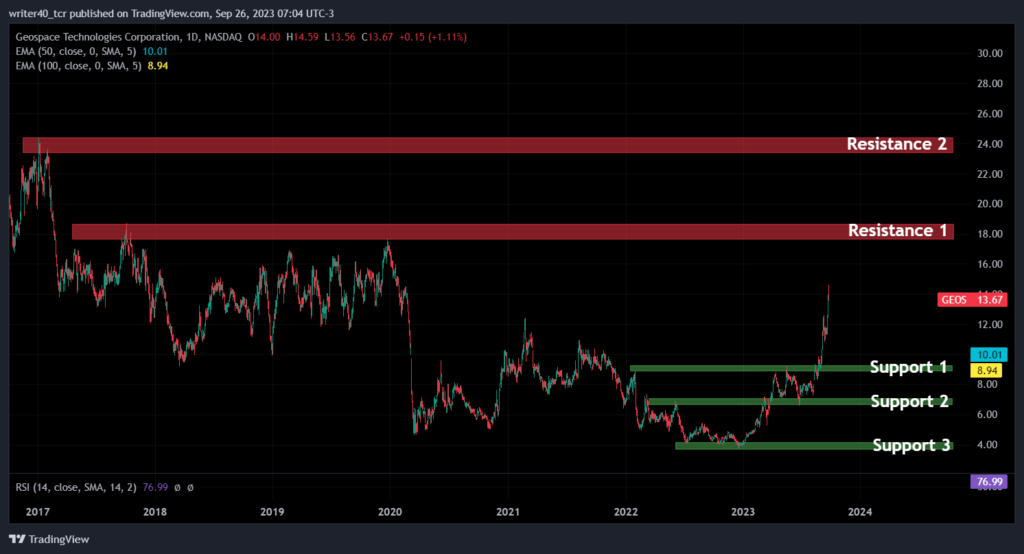
The price has skyrocketed from the lower level as we can see on the chart. Currently, the price has surged in a single way without forming any demand zone for the price. The nearest demand zone is visible at the $9.19 level, which is marked as support 1 on the chart. The next major resistance level for the price is present near the level of $17.73.
Price has formed some major demand zones on the lower levels. The second important demand zone is present near the price of $7.08, which is marked as Support 2 on the chart. The third demand zone is present near the bottom of the trend near the $4 level. If we talk about the other major resistance, it is present near the price of $24.
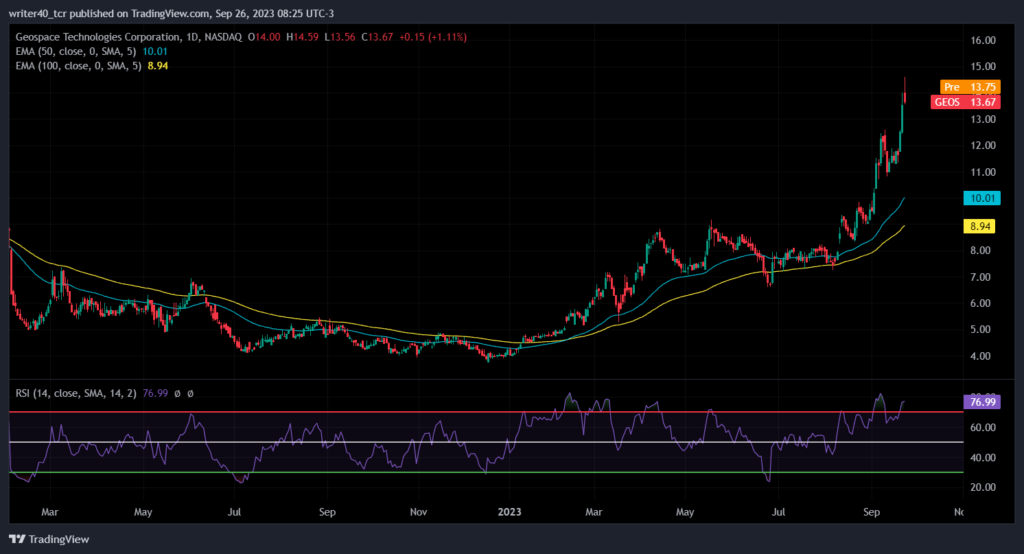
Price is currently trading above the 50-day and 100-day Exponential Moving Averages, which is a bullish sign. The slope of the EMA is Upward which signifies that the price is currently in a bull trend. The Relative Strength Index (RSI) is currently placed above the 70 level which states that the price is currently overbought and can feel some selling pressure.
Conclusion
The price is currently in an overbought zone, which signifies that the price can feel some selling pressure ahead. Price can go sideways for some time so that the RSI will cool off and then the price can resume its upward journey.
Technical Levels
Resistance – $17.73 and $24
Support – $9.19 and $7.08
Disclaimer
The views and opinions stated by the author, or any people named in this article, are for informational purposes only. They do not establish financial, investment, or other advice. Investing in or trading crypto assets comes with a risk of financial loss.



