
 Quack AI
 NEAR Protocol
 Pudgy Penguins
 Pearl
Pearl Quant
Quant Quantus
 Sui
Sui
- The price is trading above the 100-day Exponential Moving Average.
- Revenue has surged by over 21% in the latest financial report.
- The Accenture stock has surged by over 21% in a year.
The Market Capital of the Accenture -$208.846 Billion
The current market price of the Accenture -$314.38
Accenture Stock Synopsis
Accenture in its previous trading session surged by $3.77 with a rise of 1.21%. The stock has declined merely by 1.37% in a week and 1.37% in a month. It indicates that the price is consolidating at the same level for more than a month. However, the stock has surged by over 21% in a year. It shows that the bulls have dominated the price over the years.
The company has shown remarkable growth in revenue as the revenue has surged from $34.80 Billion in 2016 to $61.59 Billion in 2022. The net income of the company has shown a good improvement over the years. It has jumped from $4.11 Billion in 2016 to $6.88 Billion in 2022. If we observe the EPS, it has risen from $6.58 to $10.87 in the same period.
The overall net debt of the company is in a negative trajectory, which indicates that the company is holding a net cash surplus. The company is holding this surplus amount strongly over the years, which is a good sign for the company. This firm paid a total dividend of $3.88 in the previous financial year with a dividend yield of 1.35%. It is an ordinary dividend payout, which is not a good option for dividend-seeking investors.
Technical Analysis of Accenture Stock
The Accenture Plc stock has been trading in a flat range for more than 3 months. It is facing a strong rejection near the $330 level, which is marked as resistance 1 on the chart. Another resistance level for the stock is present near the $343 level, which is marked as Resistance 2 on the chart. The support for the price is present near the level of $300, which is marked as support 1.
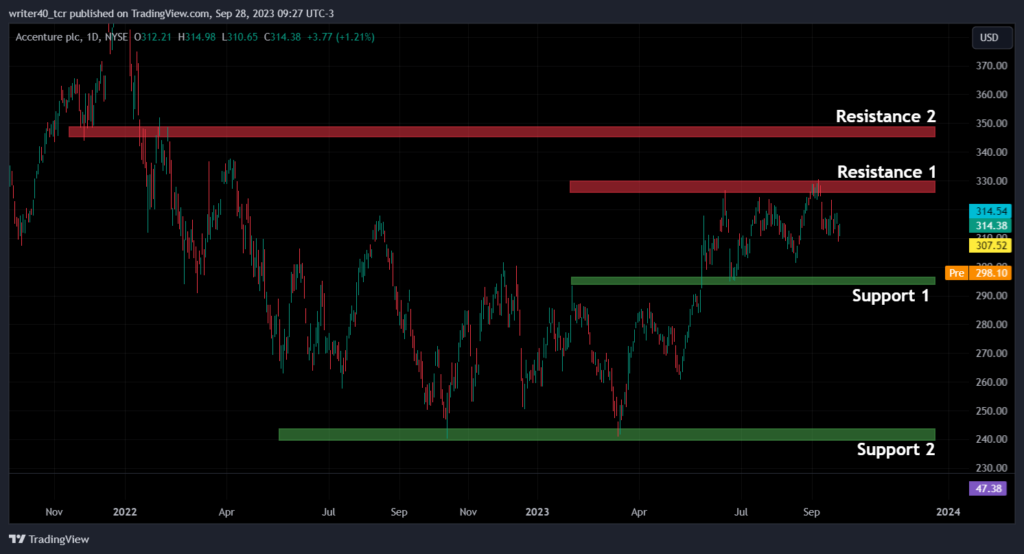
The price has started an uptrend after taking strong support from the level of $240. The price has formed a double bottom pattern and taken support from the exact same level. This support is marked as support 2 on the chart. The price has breached the resistance level in May, which is now acting as a support for the price.
Accenture is Taking Support from the EMA Levels
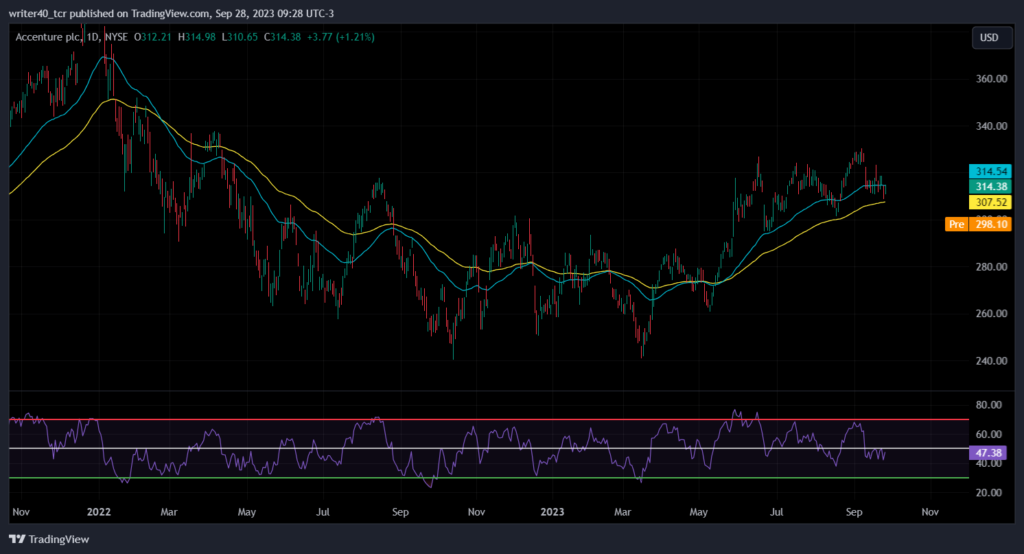
The ACN stock price is trading above the important 50-day and 100-day Exponential Moving Averages. It has taken support from these EMAs thrice, which means the stock is following the EMAs amazingly. If we observe the Relative Strength Index (RSI), it is currently placed below the level of 50. The RSI is currently sloping down. It shows that the Buyers are losing the momentum.
Conclusion
The ACN stock price is currently falling sharply from the resistance level and RSI is showing that the bears are gaining momentum. It can show some bearish momentum ahead as the selling pressure seems to be serious. $300 level can act as support for the price.
Technical levels
Resistance – $330 and $343
Support – $300 and $240
Disclaimer
The views and opinions stated by the author, or any people named in this article, are for informational purposes only. They do not establish financial, investment, or other advice. Investing in or trading crypto assets comes with a risk of financial loss.




