
 streamoors
 IGNITION
 Sword Inu
 no crying in the casino
 Altai the Tiger
 Pearl
Pearl Pudgy Penguins
- The TRB coin has recently made its yearly high of 2023.
- It is currently trading at $50.3 with a drop of 18% in the last 24 hours.
- The token is down from its all-time high by 68.15%.
The TRB token has recently made its high of this year of $67. The token started an uptrend from the last week of August and since then the price has been rising. The token has recorded an ROI of 250.02% in the last 6 months and 418.36% in the last 3 months.
Currently, The token is trading with a surge in trading volume of 79.54% in the last 24 hours. The token marked its all-time high on 10 May 2021, when a single TRB token was valued at 163.76.
- The current circulating supply of the token is 1.70M TRB which is 69.76% of its total supply.
- Its present market capitalization has dropped by 8.8% in the last 24 hours. Bringing it at a value of $81.25M.
- The 24-hour trading volume of the token is $290.34M.
Sentiment Analysis
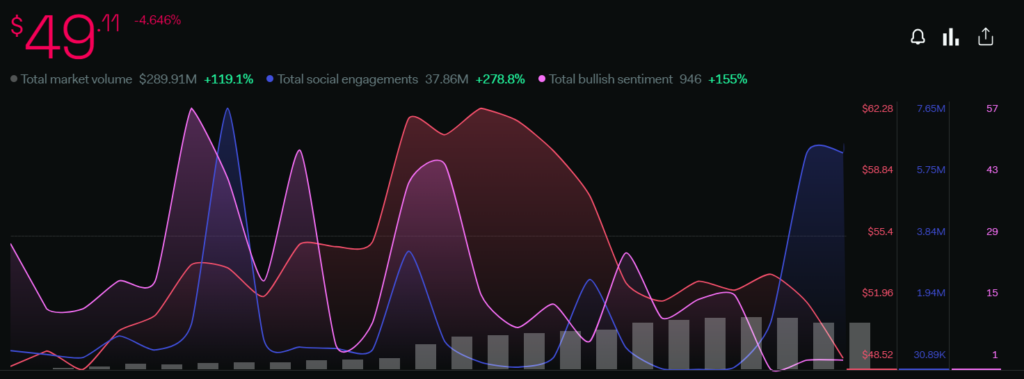
The price of the token has decreased by 4.64% and the total volume of the token has surged by 119.1% in the last 1 day. The total social engagements have increased by 278.8% and the total bullish sentiments have seen a growth of 155%. The overall sentiments are currently on the positive side that is because the price is currently in an uptrend.

The total bearish sentiments also surged by 170% as the selling activity has been started in the token after the token reached its yearly high.
Technical Analysis (Daily- 1D)
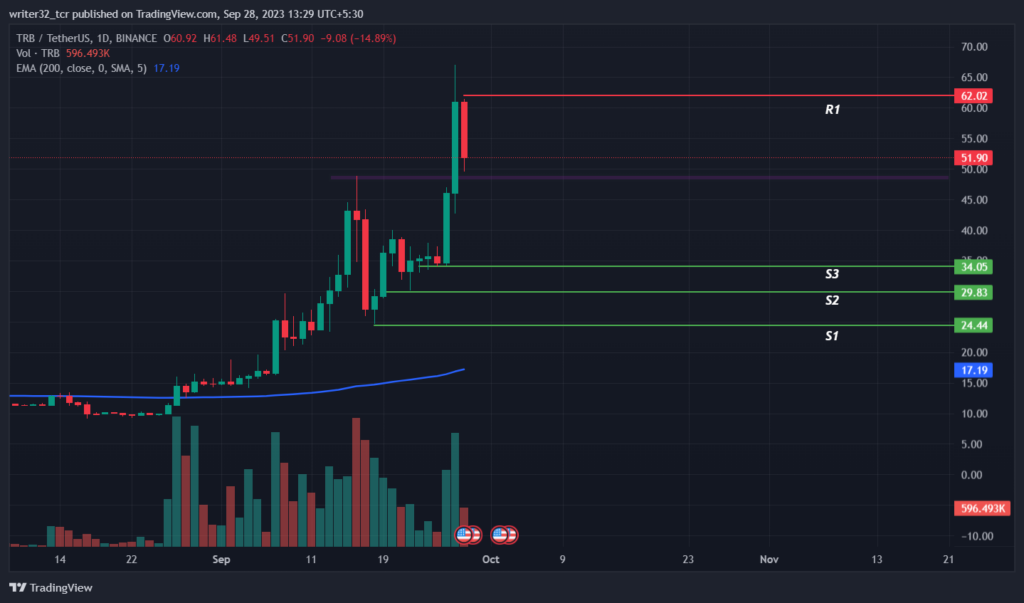
As we can see in the chart, the price started a bullish movement after getting above the 200-day EMA at the end of August and since then the price has been significantly rising with an immense volume, and the price made its yearly high of $67.
The bullish investors have been showing their dominance and they took the price upwards.
Presently, After touching the yearly high, the price has started to go bearish as the selling activity in the market has started. People are now taking the return on their investments and from here bearish investors will likely take control of the token’s market and bring the price down.
In an opposite scenario, if the price takes support from the support levels, the price may rise further and break the yearly high. It may happen only if the volume keeps on increasing and bullish investors keep their dominance on bearish investors.
Relative Strength Index (RSI)
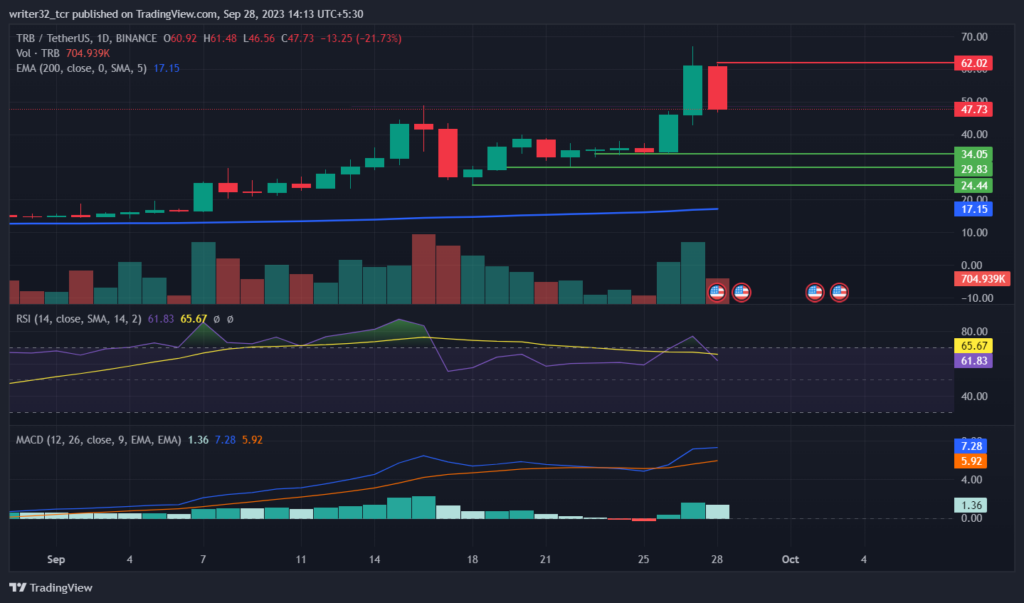
The RSI line is presently moving at 61.83 points and the SMA 14 is moving at 65.67 points. The RSI is above the neutral level of 50. The RSI went up to 757.89 points, where it entered the overbought zone. From there, the selling activity started and the RSI came down and crossed below the SMA 14. If the RSI goes below the neutral level, it will be bearish for the token’s price.
Moving Average Convergence/Divergence (MACD)
The fast blue line moving average is moving above the red slow line moving and it is moving above the average level 0. The volume in the histogram shows that the volume has started to decrease as the selling activity has started and if the volume will stay decreasing then the price will fall down. The volume has to be significantly rising if we need further upside movement.
TRB LIVE CHART :
Conclusion
The selling activity has started in the market, which indicates that the price might start a downtrend as the price has marked its yearly high. From this point, the price may reverse the trend and start a bearish trend.
If the volume started to increase and the bulls took over, the price might grow further and cross above the yearly high.
Technical Levels
Support: $24, $29, $34
Resistance: $62 And $67
Disclaimer
The views and opinions stated by the author, or any people named in this article, are for informational purposes only and do not establish financial, investment, or other advice. Investing in or trading crypto assets comes with a risk of financial loss.




