
 Quantus
 Starknet
 Pearl
Pearl Celestia
 Injective
 Sui
Sui NEAR Protocol
- The CRM stock price is trading very close to the support level of $200.
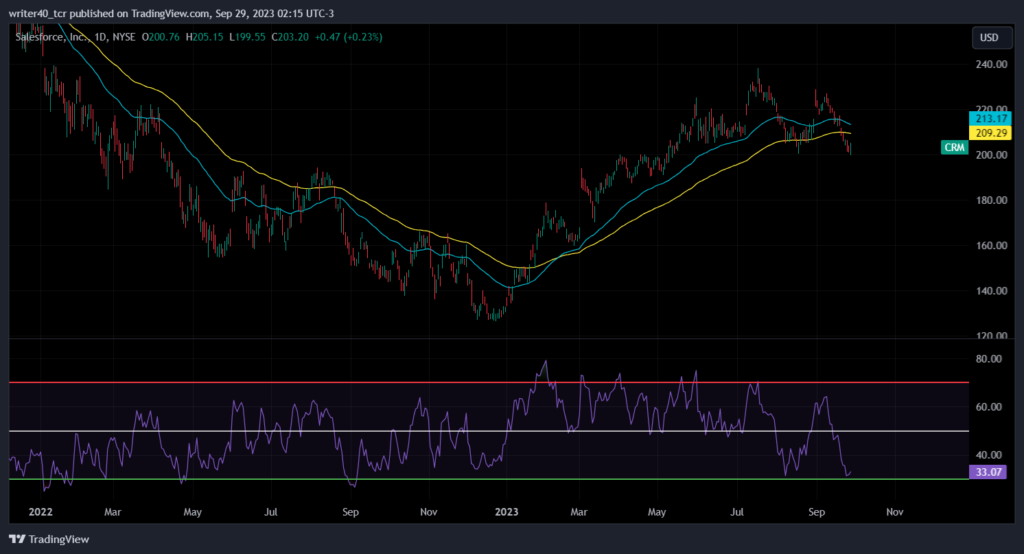
- It has started trading below the 50-day and 100-day Exponential Moving Averages.
- The stock has surged by over 39% in a year.
The Market Capital of Salesforce Stock – $197.71 Billion
The Current Market Price of Salesforce Stock – $203.20
Salesforce Stock Synopsis
The Salesforce stock price has increased by $0.47 with a rise of 0.47% in its previous trading session. The stock price has declined massively from the upper level as it has ended a day in red in 10 sessions out of 13. It has declined by over 3% in a week, which signifies that the stock price is witnessing some selling pressure from upper levels.
The price has surged by over 39% in a year on a strong financial outcome. Salesforce in its previous 2 quarters has posted increased revenue, which is a good sign for the company. However, the revenue has jumped by only 11% in both quarters. The net income of the company has jumped massively in the last quarter by over 1700%. It boosted the price of the stock.
In the last 2 financial years, the net debt of the company has increased a lot. The company was in a net cash surplus in 2020, but then in the next financial year, the company was submerged in debt. Its debt has increased to $3.83 Billion from the net cash surplus of $5.56 Billion. Although the company’s debt has narrowed down in the previous financial year to $2.37 Billion.
Technical Analysis of Salesforce Stock
Salesforce stock is trading in a flat range between the level of $200 and $230. Both buyers and sellers are aggressive in their area as the price is witnessing a massive decline and jump from these levels. The price is testing the previous resistance level of $200 for the second time. It breached that level in May 2023, and since then this level has been acting as a support for the price.
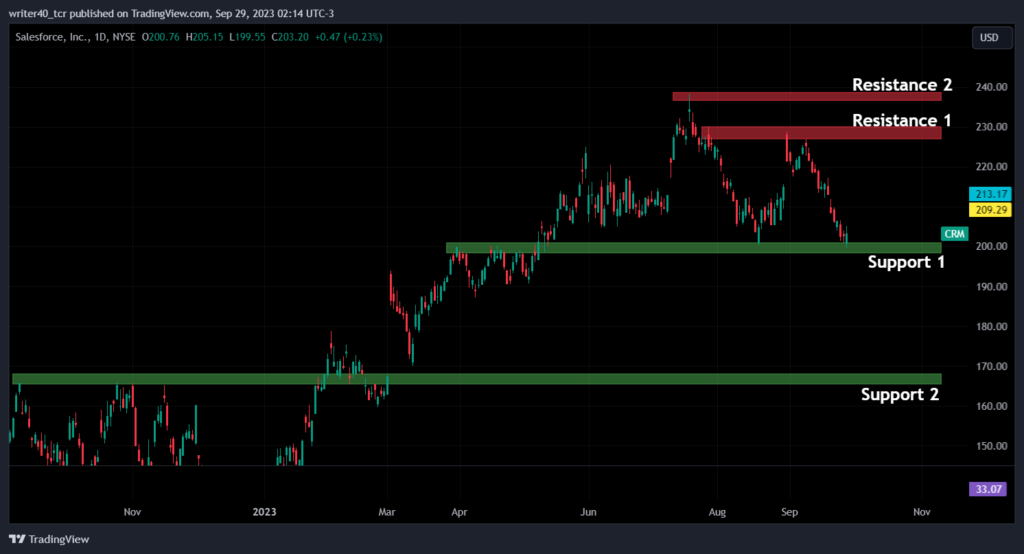
If we consider the support and resistance level of the stock, then the nearest resistance visible on the chart is near the $230 level. Another resistance level for the stock is present near the $238 level, which is also a swing high for the stock. The support for the price is present near the area of $200 and $168 respectively, which can push the price up.
50-day and 100-day Exponential Moving Averages are Flat Now
The price has breached the 50-day and 100-day Exponential Moving Averages. It is currently trading below them. It is a bearish sign for the stock as the price is sustaining below the EMA for the first time since Jan 2023. If we consider the Relative Strength Index (RSI), it is trading very close to an Oversold trajectory. That means the price can halt the selling.
Conclusion
The price is trading below the important EMA levels, but the RSI is very close to the Ovrsold trajectory. It can halt the selling here. The price is very close to the support level of $200 which can push the price up. If the price rises from this level then it can face the rejection near the $230 level. If the price breaches the support level and sustains below, it can try to achieve the $168 level.
Technical levels
Resistance – $230 and $238
Support – $200 and $168
Disclaimer
The views and opinions stated by the author, or any people named in this article, are for informational purposes only. They do not establish financial, investment, or other advice. Investing in or trading crypto assets comes with a risk of financial loss.




