
 Pearl
Pearl Ondo
Ondo Starknet
 Quantus
 Aerodrome Finance
 Pudgy Penguins
 Akash Network
- The General Electric Company stock is in a strong uptrend.
- The GE stock has surged by over 121% in a year, which indicates bullishness.
- This company has posted a net profit in 2022, after showing a massive loss in 2021.
The market capital of GE Company – $122.268
The current market price of GE company – $112.34
The General Electric Company Stock Overview
The GE stock in its previous trading session has jumped by $1.45 with a rise of 1.31%. Its price has formed a bullish candle on the chart and ended the day with some profit booking as the candle formed a wick. Stock’s price has slightly declined by over 1% in a week and a month, which indicates that the price is consolidating at a higher level. However, the stock has surged by over 121% in a year. That shows that the overall trend is bullish.
If we assess General Electric’s revenue, it has declined marginally from $119.87 in 2016 to $76.57 Billion in 2022. An overall decline of over 34% in 6 years shows that the company’s revenue has shrunk and it has to improve the revenue. If we examine the net income, the company has done well in the previous financial year. This company has posted a net profit of $29 million. It has reported a massive loss of $2.67 Billion in 2021.
The GE company has done well in reducing its net debt. The net debt in 2016 was $88.08 billion, which has reduced to $9.87 Billion in 2022. That is a good sign for a company as the company is on the verge of becoming a debt-free organization. The company paid a dividend of $0.32 in the previous financial year of 2022 with a dividend yield of just 0.38%. It is not at all a good dividend payout.
General Electric Company’s Technical Analysis
The General Electric Company has surged by over 121% in a year, which itself means the price has been dominated by bulls throughout the year. The price has risen sharply without any major correction since December 2022. It is consolidating on the higher side, which indicates that the price is forming a base, and it can be followed by another rally. The stock has formed a base at the bottom level, where the stock has spent more than 4 years and then gave a breakout in March 2023.
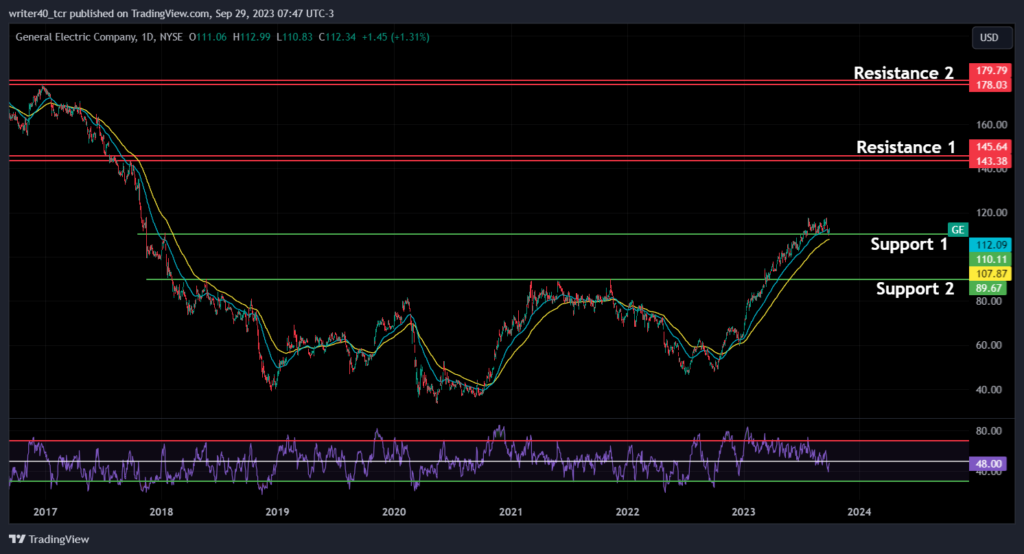
The crucial resistance level for the price is present near the $143.38 level. It is marked as Resistance 1 on the chart. The price is consolidating at the support level near $110. Another support for the price is present near the $90 level. Other resistance for the price is present near the level of $178. If we talk about the indicators, the price is trading above the 50-day and 100-day Exponential Moving Averages. However, the RSI is showing that the bulls have lost momentum.
Conclusion
The price is in a strong uptrend but it is looking exhausted. It was necessary for the stock to consolidate before the upward move. That consolidation is very beneficial for the stock to resume its uptrend. The price can face rejection from the level of $143 and $178. The levels that can act as support are present at $110 and $89.
Technical Level
Resistance -$143 and $178
Support -$110 and $89
Disclaimer
The views and opinions stated by the author, or any people named in this article, are for informational purposes only. They do not establish financial, investment, or other advice. Investing in or trading crypto assets comes with a risk of financial loss.




