
 Quantus
 Starknet
 Pearl
Pearl Celestia
 Injective
 Sui
Sui NEAR Protocol
- The DIS stock price is currently trading at $79.96.
- The stock price is currently trading inside a falling wedge pattern.
Walt Disney (NYSE: DIS) is an American mass media and entertainment conglomerate. It provides global entertainment and media enterprises. The firm owns television and radio production, and broadcasting enterprises, studios, and streaming apps.
Walt Disney Q3 Report
This company has recently reported its quarter 3 earning reports on 1 July 2023. The company’s revenue surged by 3.7% compared to its previous year’s Q2 report. However, the net income reported in the Q2 report showed a decrease and was down by 132% compared to its Q2 2023 financial report.
The company has maintained its equity to debt ratio below 1% since the Q1 2022 report. It shows the company has performed well in these quarters and it could also have a good impact on the company’s future performance.
Walt Disney (DIS) Stock: Technical Analysis
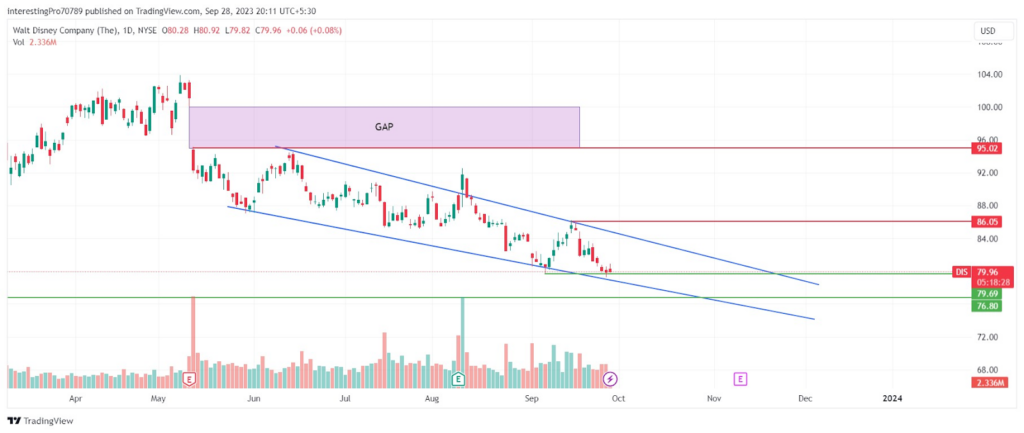
In the 1-day chart of the DIS stock, the price seems to be trading inside a falling wedge pattern after a gap before it started its fall. The price has experienced a decline of 5.84% in the last 8 trading sessions.
The price has formed its recent high of $86.05 and low of $79.69. It is trading in between the recent high and low. It is currently taking support from the $79.69 level. If the price manages to break below $79.69 support, it can fall to its next support at $76.80.
Suppose the buyers get control of the price at $79.69 support, a trend reversal may occur. It can rise to $86.05, which will eventually give the breakout of the falling wedge pattern. This move will boost the buyers’ confidence and the price could also break above the $86.05 level. It can lead the price to rise to $95.02 level and also fill the gap left in the market.
Technical Indicators on the Current Trend
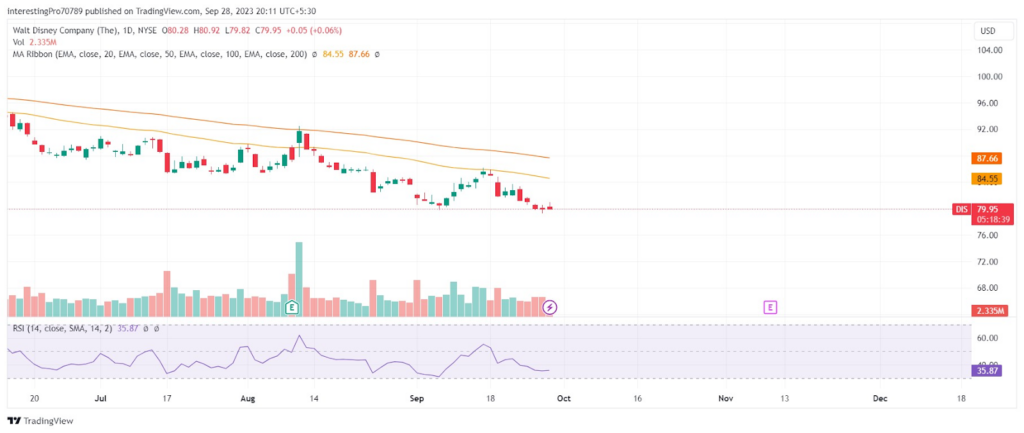
The DIS price is trading below 50-day and 100-day EMAs. The price has faced rejection by the 50-day EMA and is falling. It shows the sellers are highly active in the current scenario and are making the price fall.
The relative strength index is at 35.87. The RSI line is in a bearish territory and is sloping in a downward direction. That indicates the sellers can make the price fall even more as there is space still left for them.
Conclusion
The DIS stock price is currently bearish as the price fell after creating a gap that is yet to be filled. The indicators are also pointing towards the bear market to be continued in the future.
Technical levels
Resistance Levels: $86.05 and $95.02.
Support Levels: $76.69 and $76.80.
Disclaimer
The views and opinions stated by the author or any other person named in this article are for informational purposes only. They do not provide financial, investment, or other advice. Investing in or trading comes with a risk of financial loss.




