
 Pearl
Pearl Bitway
 Pudgy Penguins
 Quantus
 Walrus
 Quant
Quant Artificial Superintelligence Alliance
- BTT has been in a significant phase of downfall since it marked its yearly high.
- It is currently trading at $0.000000387 with a rise of 0.15% in the last 24 hours.
- The token is down from it’s all-time high by 87.31%.
BitTorrent token has recorded notable losses of 37.44% in the last 6 months and 18.51% in the last 3 months. The token has marked yearly high of $0.000000916 in the mid of april.
After the price touched its yearly high the price has been significantly falling and currently it has marked the yearly low of $0.0000003767 from where the price has taken support and it is presently trying to move upside.
The token marked its all-time high on 18th Jan 2022 where the token was priced at $0.000003054.
The token is currently trading with a decline in the trading volume by 4.98% in the last 24 hours.
- The present market capitalization of the token is $369.42M.
- It has a circulating supply of 951,421,714,286,000 BTT.
- The 24-hour volume of the token is $15.56M.
Sentiment Analysis :
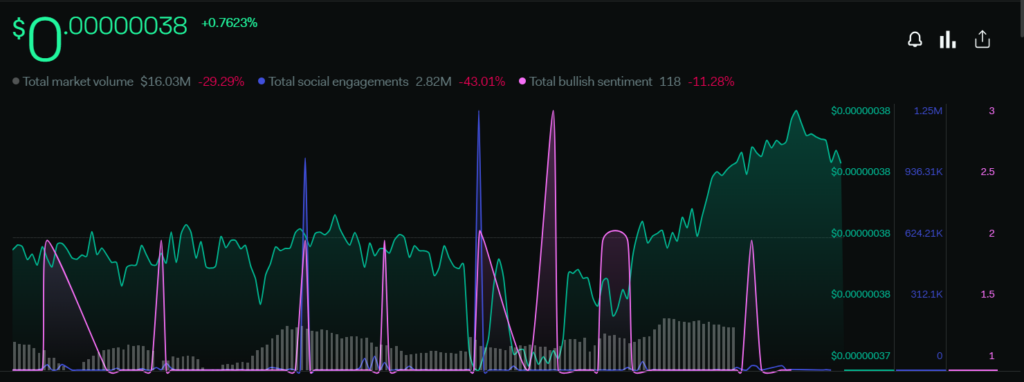
The price of the token has increased by 0.76% and the total market volume has declined by 29.29% in the last 1 week. The social engagements dropped by 43.01% and the total bullish sentiments also decreased by 11.28%. The overall sentiments are showing a negative move in the price of the token due to falling volume and the drop in the social engagement in the community.
Technical Analysis ( Daily – 1D ) :
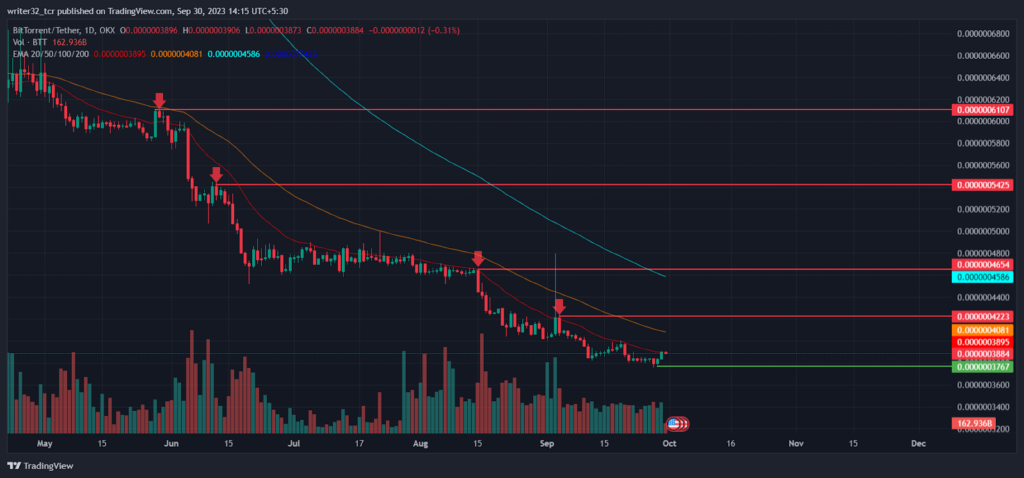
As we can see in the chart, The price of the token is plunging after its yearly high and since then the price of token has dropped almost by 50%. Presently, the price took support from the level of $0.000000376 and the price is trying to make an upside movement.
Firstly, If the price has to be bullish then the price has to break the resistance levels of $0.000000422 and then $0.000000465 with a sizable amount of volume and here the bullish investors have to play a major role in breaking these resistance by keeping their dominance on the bearish investors.
Also, If the price gets a rejection from the resistance then the price can fall again to the support level of $0.0000003767 or even further if the volume decreases.
The price is presently below all the 20,50,100,200 day EMA which represents a bearish sign for the price.
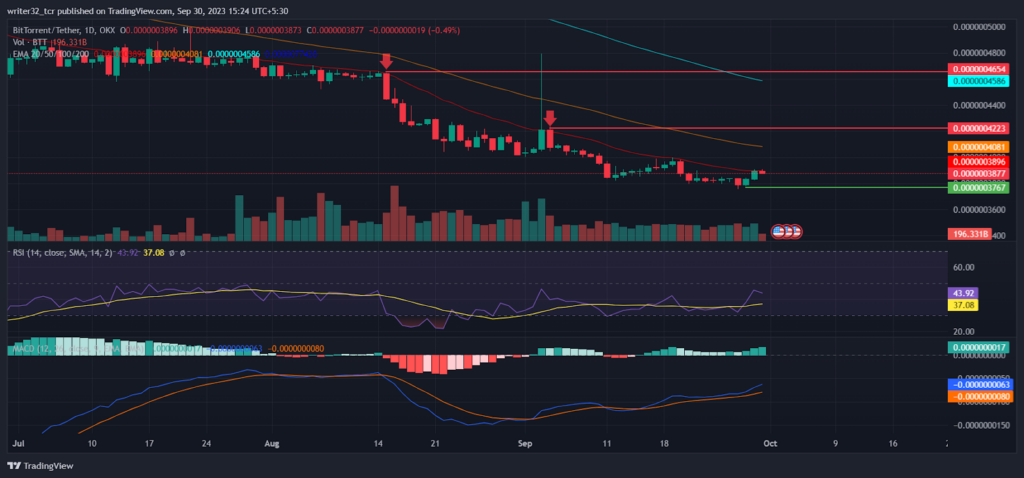
Relative Strength Index ( RSI )
The RSI line is presently moving at 42.57 points and the SMA 14 is moving at 30.91 points. The RSI is currently below the neutral level 50. The RSI is trying to move above the neutral level and if it successfully gets above the neutral level then it will be a positive sign for an upside move.
Moving Average Convergence/Divergence ( MACD )
The fast blue line moving average is above the red slow line moving average and the volume of the histogram is showing some increases in the volumes which are a good sign for but it has to be significantly rising for the bullish move.
Conclusion :
The break of the resistance level of $0.000000422 and $0.000000465 is important for an upward movement and once it gets above the 100-day EMA then the price will be bullish for a short-term time period until then the price will be under a bearish move only if it gets rejected from the resistance level.
BTT LIVE CHART :
Technical Levels :
Support : $0.000000376
Resistance : $0.000000422, $0.000000465, $0.000000542 and $0.000000610
Disclaimer :
The views and opinions stated by the author, or any people named in this article, are for informational purposes only and do not establish financial, investment, or other advice. Investing in or trading crypto assets comes with a risk of financial loss.




