
 Quack AI
 NEAR Protocol
 Quant
Quant Quantus
 Pearl
Pearl Ondo
Ondo Bitway
- The stock price has surged by 2.39%.
- The company stock price is in an uptrend.
Cisco System (NASDAQ: CSCO) is a digital communication technology conglomerate corporation. The company deals in the manufacture and sales of Internet Protocol-based networking products. The firm also provides services related to communications and information technology.
Cisco System (CSCO) Stock: Technical Analysis
The CSCO stock price is currently at $53.76 and has traded with a volume of $13.951 million in the last trading session. The current market capitalization of the stock is valued at $217.989 billion. The stock price trades with a 10-day average volume of $16.69 million.
Technical Analysis on 1-day Chart
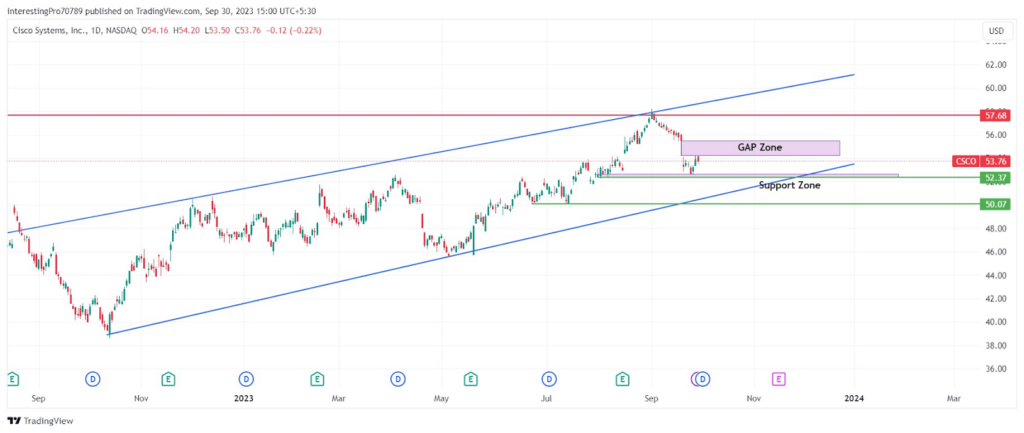
The CSCO stock price is bullish on a 1-day timeframe as the price is trading inside a rising channel. Secondly, the price is trading above its previous swing high. The stock price has fallen by 6.28% in the last 18 trading days after facing rejection from its $57.68 resistance level.
While falling after facing rejection from its resistance, the price left a gap that is yet to be filled. Recently, the price has taken support from the $52.37 support level and has recovered 2.39% of the fall in just 3 trading days.
The price is trading just below the gap zone and it looks like this zone will be filled in the upcoming trading session as the recovery seems strong. The reversal candle called ‘Hammer’ has also formed at the $52.37 support level. This shows that the buyers are active in the current zone. If the price fills the gap, it can retest its $57.68 resistance level.
However, for the price to continue its fall it must give the breakdown of the $52.37 support level. Subsequently, it may be seen falling to its next support at $50.07.
Technical Indicators on the Current Trend
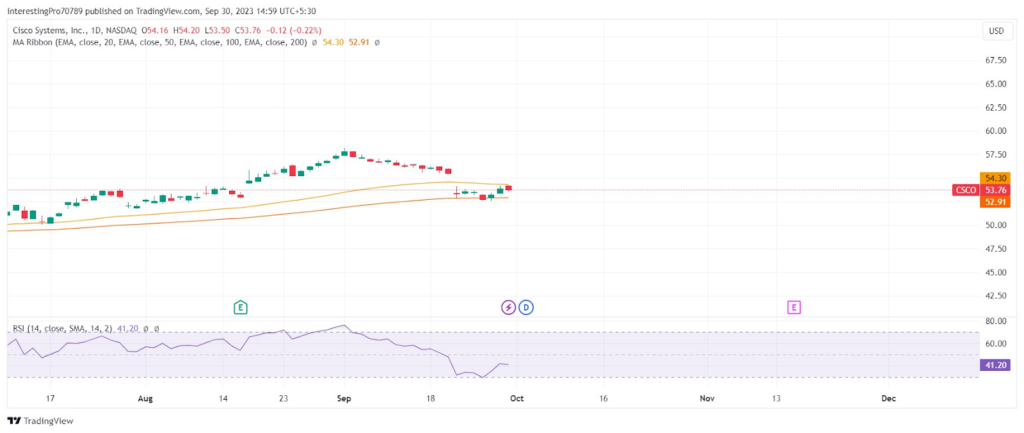
The price has recently taken support from the 100-day EMA. If the next candle gives the breakout of the 50 EMA, the price can go up and fill the gap that is left. It could also retest the $57.68 resistance level.
The RSI is below 50 but is sloping in an upward direction after taking support from the 30 RSI level. This indicates that the recovery in the price has started. The RSI moving up indicates that there is more room on the upside for the price to rise.
Conclusion
The CSCO stock price is experiencing bullish sentiments as the price is trading in a rising parallel channel.It is trading above its previous swing high and has taken support from the $25.37 support zone. The last sign of continuation of the bullish rally is that the price has left a gap above which is yet to be filled. The indicators are also pointing towards a rise in the price.
Technical levels
Resistance levels: $57.68.
Support levels: $52.37 and $50.07.
Disclaimer
The views and opinions stated by the author, or any people named in this article, are for informational purposes only. They do not establish financial, investment, or other advice. Investing or trading comes with a risk of financial loss.




