
 streamoors
 IGNITION
 Sui
Sui Quantus
 Bitcoin
 Pearl
Pearl Solana
- The Render Coin has surged by a massive 235.99% in a year.
- The token price is trading close to the resistance level of $1.70.
- Its current market price is $1.705.
The Render coin price is trading in a tight range and currently facing a strong rejection from the level of $1.70. The Coin price has created a few shooting star patterns at this level, which indicates that the price is strongly bearish. The RNDR coin price is forming higher highs and higher lows. It hints the price is changing the structure. In the current trading session, the price is trading with a decline of $0.013 or 0.75%.
RNDR coin’s price has surged by over 16% in a week, 27% in a month, and 235% in a year. That shows that the price has been dominated by the bulls throughout the year. However, sellers tried to push the price down and they succeeded in doing so. The coin price is trading with a decline of over 41% from the 52-week high level. It shows that the price is currently under the influence of the bears.
RNDR coin’s price has formed a base between the level of $0.4 and $1 in the previous year. The coin has given a breakout of this level at the beginning of the year. After the breakout, the price surged by over 600% from the bottom level to the highs. The coin price is rising in a channe,l but the slope of the channel is looking bearish.
A Deep Dive Into the Daily Charts
On the daily chart, the RNDR’s coin price is facing a strong rejection from the $1.767 level. This level is marked as Resistance 1 on the chart. The second resistance level is present at $2.32, which is marked as Resistance 2 on the charts. The RNDR coin price has formed a downward-sloping trendline, which has pushed the price down more than 5 times. The Coin price gave a breakout of this trendline recently in the September month series.
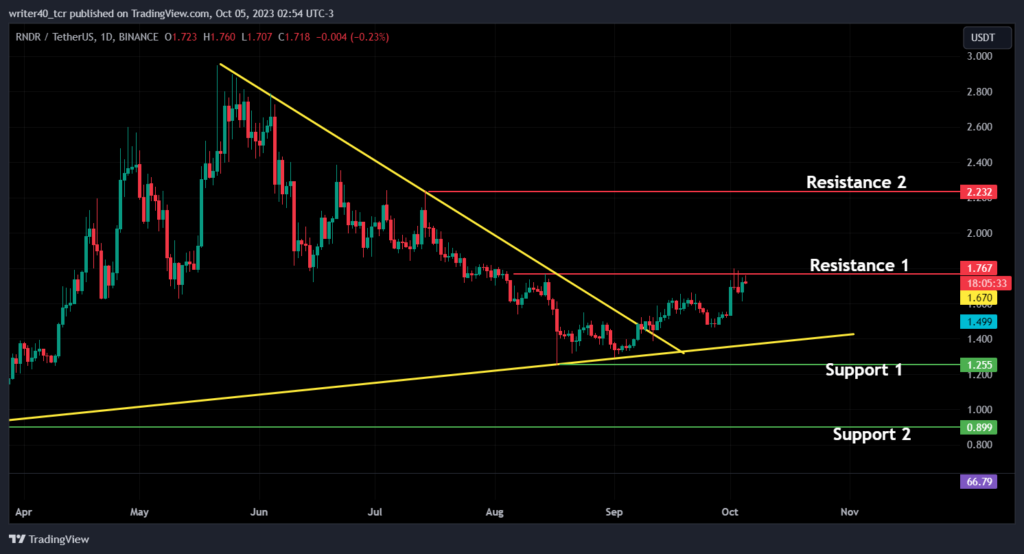
The price was supported by the rising trendline and it is still intact. The first support for the price is present at the $1.255 level and the second support is present at the $0.899 level. Both the levels are marked as support 1 and support 2 respectively.
Exponential Moving Average
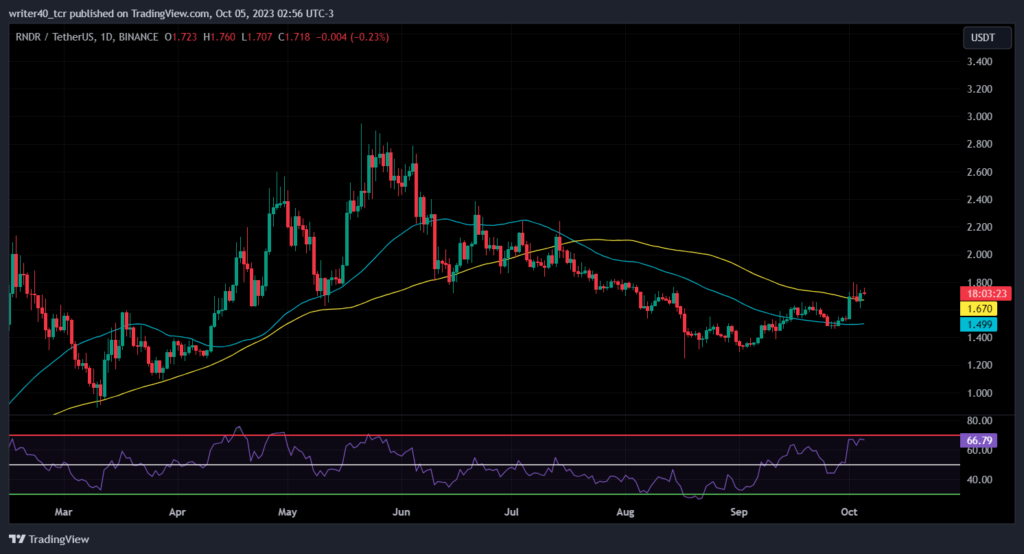
The Render coin price is trading above the 50-day and 100-day Exponential Moving Averages. However, the slope of the EMA is still downward, but the price is showing strength. It can help change the slope in near time.
Relative Strength Index
The Relative Strength Index is showing a strong momentum, which is favouring the Bulls right now. The RSI is currently placed at 66.79 level, which means the coin is bullish. The RSI has shown a divergence, and the price has been responding positively till now.
Conclusion
The Render coin price is showing strength as we have discussed above. It is changing the chart structure from bearish to bullish, which is a good sign. Both the indicators are favouring the bulls, which can push the price up. If the price breaks the resistance level of $1.767, it can move towards $2.232. Suppose the price breaks the support of $1.255, it can move towards $0.899.
Technical Level
Resistance – $1.767 and $2.232
Support – $1.255 and $0.899
Disclaimer
The views and opinions stated by the author, or any people named in this article, are for informational purposes only. They do not establish financial, investment, or other advice. Investing in or trading crypto assets comes with a risk of financial loss.




