
 Dacity Coin
 Celestia
 Pudgy Penguins
 Injective
 Solana
 Sui
Sui Starknet
- The price of the dYdX token is presently moving sideways and it is following a trendline.
- It is currently trading at $1.98 with a rise of 0.36% in the last 24 hours.
- The token is down by 92.86% from its all-time high.
The dYdX token has marked its yearly high of $3.67. After marking its yearly high, the bears became active and since then the price dropped by almost 50%.
The token marked its all-time high on 30th September 2021 when it was priced at $27.78.
It is currently trading with a reduction in the trading volume by 37.2% in the last 24 hours.
- The present market capitalization of the token is $362.87 Million.
- It has a current circulating supply of 183.76 Million dYdX which is only 18.38% of its total supply.
- The 24-hour trading volume of the token is $22.92 Million.
Sentiment Analysis
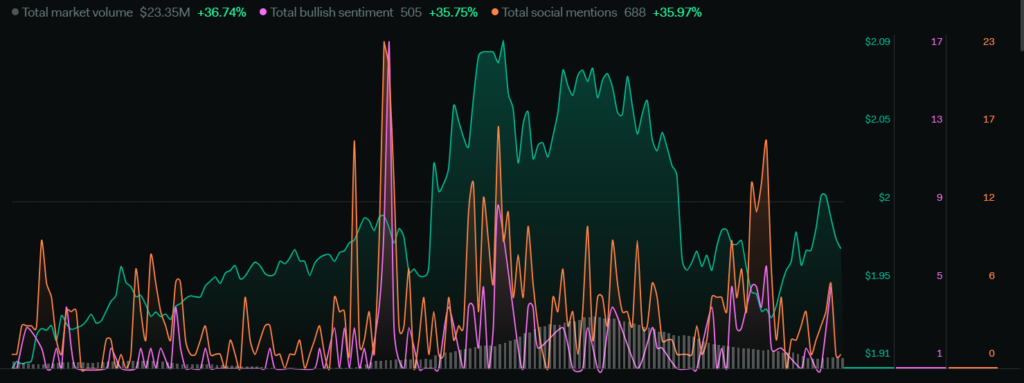
The total market volume of the token has increased by 36.74% in the last 7 days. The total social mentions have surged by 35.97%. Total bullish sentiments have seen a rise of 35.97%. The overall sentiments are indicating a positive price action as the volume is rising and the social community is active.
Technical Analysis ( Daily – 1D ) :
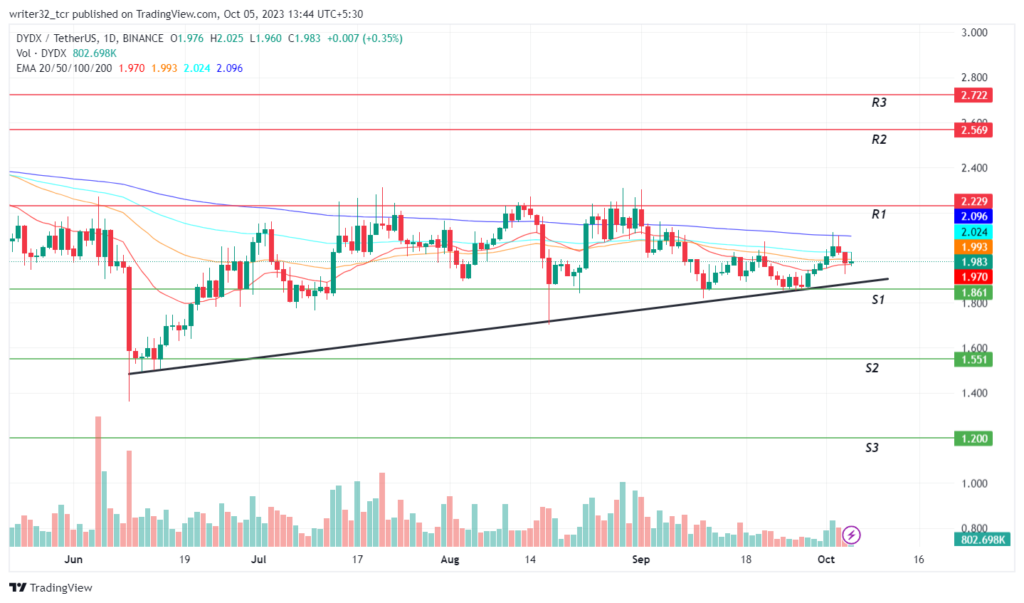
Presently, the price of dYdX is moving sideways between the levels of $1.86 and $2.22. The price is also moving on a trendline from where the price is getting significant support from the trendline.
If the price takes support from the trendline and moves upside with a great amount of volume, then the price can break the resistance level of $2.22 and also break out of the sideways movement and give a bullish move.
Additionally, if the price breaks below both the trendline and the support level of $1.8, then the price can fall to the support level of $1.55 or even lower to $1.2, which is a historic support level.
What Indicators Say About dYdX
Relative Strength Index (RSI)
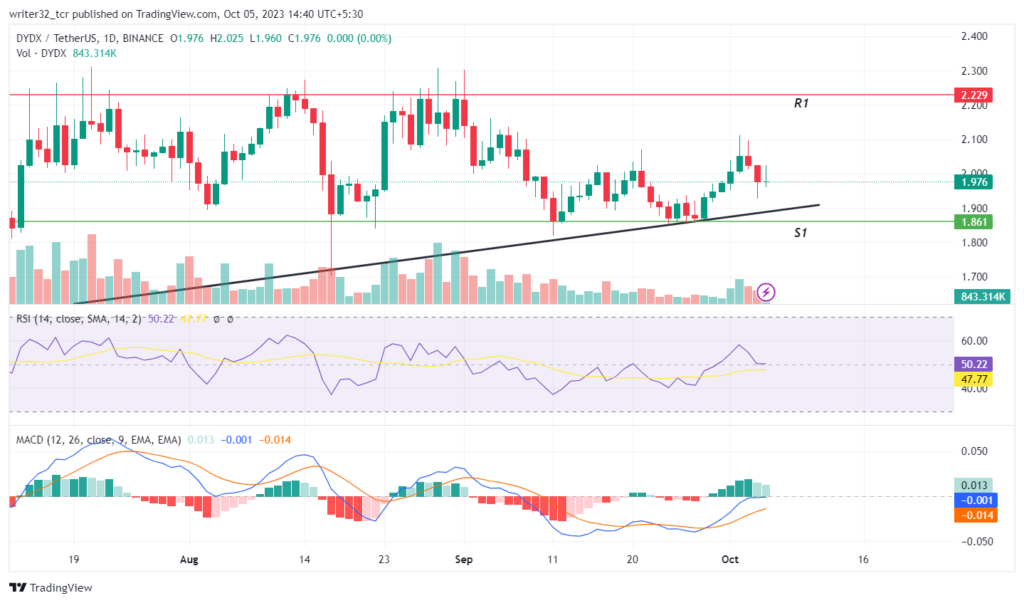
The RSI line is presently at 50.22 points and the SMA 14 is at 47.77 points. The RSI is presently at the neutral level and if the price moves up, it will be a positive indicator for a bullish move. On the other hand, If the RSI moves down and the volume gets low, then it could be the start of a bearish trend.
Moving Average Convergence/Divergence (MACD)
The fast blue line moving average is above the red slow line moving average. The volumes in the histogram are showing a drop in the volume levels which is a negative sign for the price action. If the price has to move up then the volume has to be rising significantly.
DYDX LIVE CHART
Conclusion
If the dYdX token breaks the trendline and the support level of $1.8, then the price may gain bearish momentum and start falling.
On the other hand, If the price gets support from the $1.8 range or from the trendline, then the price will move upwards till the $2.22 resistance and if the volume stays strong, the price can break the resistance and touch the level of $2.5.
Technical Levels
Support: $1.8, $1.5 and $1.2
Resistance: $2.2, $2.5 and $2.7
Disclaimer:
The views and opinions stated by the author, or any people named in this article, are for informational purposes only and do not establish financial, investment, or other advice. Investing in or trading crypto assets comes with a risk of financial loss.




