
 Dacity Coin
 NEAR Protocol
 Pearl
Pearl Pudgy Penguins
 Injective
 Aerodrome Finance
 Pump.fun
- The ZEC token has been facing a significant downfall for a long time.
- It is currently trading at $27.25 with a growth of 1.64% in the last 24 hours.
- The token is down by 99.54% from its all-time high.
ZEC marked its yearly high of $51 from where the token has been moving in a downtrend. It has recorded a 27.8% decline in the price in the last 6 months and 10.2% in the last 3 months. Additionally, the token has been moving in a falling wedge pattern.
The token marked its all-time high on 29th October 2016 when it was priced at $5941.
It is currently trading with an increase in the trading volume by 1.92% in the last 24 hours.
- The present market capitalization of the token is $445.27 Million.
- It has a current circulating supply of 16.32 Million ZEC, which is 77.75% of its total supply.
- The 24-hour trading volume of the token is $40.73 Million.
Sentiment Analysis
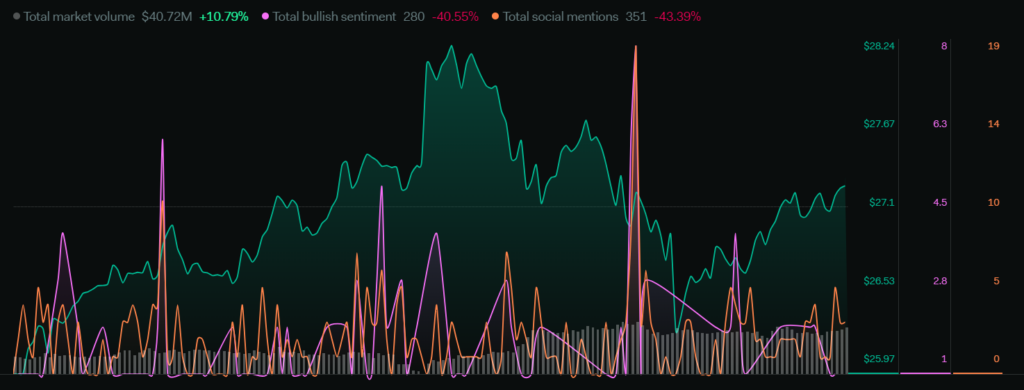
The total market volume of the token has surged by 10.79% in the last week. Total social mentions decreased by 43.39% and the total bullish sentiments declined by 40.55%.
The overall sentiments are indicating a negative price action but the volume is still rising which is a positive sign and the price can still gain upside movement if the volume keeps on increasing significantly.
Technical Analysis Of ZEC Token ( Weekly – 7D )
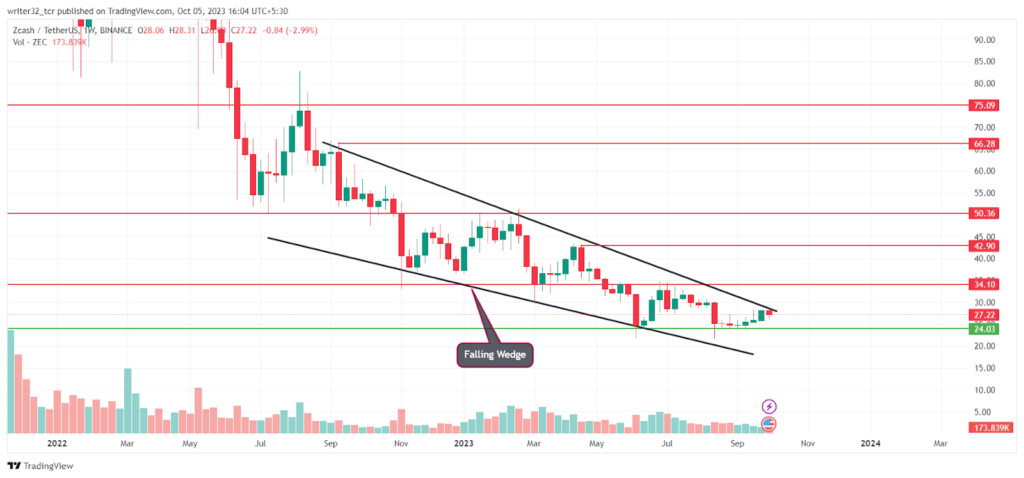
Currently, ZEC price has taken support from the $24 level and is trying to move upwards. If the price breaks above from the top of the falling channel and breaks the last lower low which is at the resistance level of $34, then the price can gain bullish momentum and reach the ranges from $42 to $50.
On the other hand, if the price gets rejected from the top of the falling wedge or from the resistance level of $34, then the price can retest the support level of $24 or break below it and and continue its downtrend.
What Indicators Say About ZEC
Relative Strength Index (RSI)
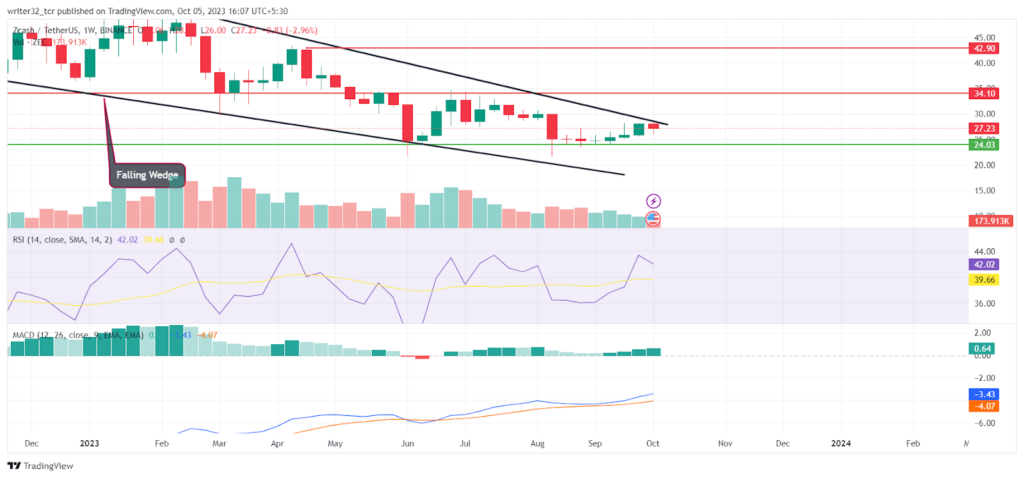
The RSI line is presently at 42.02 points and the SMA 14 is at 39.66 points. The RSI is presently moving below the neutral level of 50. The RSI indicates the bearish trend of the token. If the RSI moves above the neutral level with an increased volume, then the price might start moving upwards.
Moving Average Convergence/Divergence (MACD)
The fast blue line moving average is above the red slow line moving average. The histogram is showing low volume levels which is a negative sign for the price action. The volume has to increase for a bullish movement.
ZEC LIVE CHART
Conclusion
If the price breaks above from the top of the falling channel and also breaks the resistance level of $34, then the price can gain bullish momentum.
On the other hand, if the price gets rejected from the resistance level or from the top of the falling wedge, then the price will continue its downfall.
Technical Levels
Support: $24
Resistance: $34, $42, $50, $66 and $75.
Disclaimer:
The views and opinions stated by the author, or any people named in this article, are for informational purposes only and do not establish financial, investment, or other advice. Investing in or trading crypto assets comes with a risk of financial loss.




