
 Covenant x402
 Doge Pepe
 Tetsuo Super Intelligence
 Claudia
 Boomer
 hi
hi Quantus
- The STIX stock price has declined by 3.54% since the last trading session.
- The stocks shows sellers’ domination in the current scenario.
Semantix Inc. (NASDAQ: STIX) is a software platform company that deals in the provision of data-centric platforms. The company specializes in Big Data, Artificial Intelligence, and Data Analytics.
Semantix Inc. Stock Price Analysis
STIX stock price is currently trading at $1.91, where it has faced a decline of 3.54% since the last trading session. The company’s share market capitalization currently stands at 150.208 million USD, whereas it trades with a 10-day average volume of $47.48K.
Are Sellers Dominating the 1-Day Chart of STIX Stock?
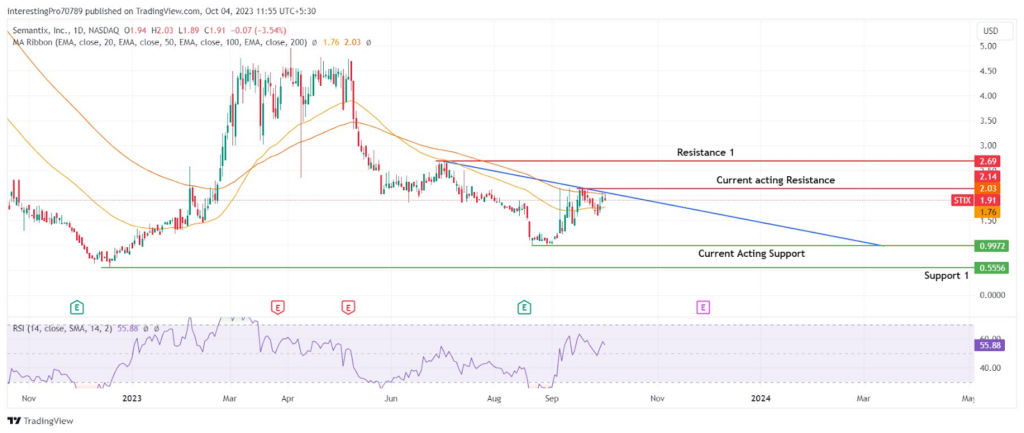
The STIX stock has been continuing its downtrend after it created its 2023 year high. Around mid-August 2023, the price formed a support of $0.9972 and has initiated a bullish trend. The price has risen to 74.27% in the last 29 trading days after it formed support at $0.9972. However, it seems that the sellers are dominating the price as a Lower High is forming in the current scenario.
If we observe the 1-day chart of the STIX stock, it seems that the price is also facing resistance from the trendline.
The Semantix price has faced rejection from the 100 EMA in the last two trading sessions. However, the price is trading above the 50 EMA, which shows its indecisive nature in the current scenario.
The RSI after trending in the upward direction has now started to slope in the downward direction. The RSI is in bullish territory but somehow the sellers are still influencing the price which is making the RSI slope in a downward direction.
The STIX price is currently facing rejection from the trendline which has made it form a lower high of $2.14. It could be also observed that it is trading in a range of $2.14 to $0.9972. So, now if the price breaks below $0.9972 after it falls it faces resistance from the trendline. Thus, it may fall to its next support at $0.5556 and will continue its fall in the lower high formation.
However, for the STIX stock price to be in bullish sentiment it must have closed above the $2.14 resistance. Which will put a stop to lower high formation and seller’s control over the price. That’s how it would rise to its immediate resistance at $2.69.
Conclusion
The STIX on a 1-day chart is bearish. The price has formed a support of $0.9972 and has initiated a bullish rally. However, the price has faced rejection from the trendline and has formed a lower high. If the price falls from here and breaks below the $0.9972 support, it may continue its fall in the lower high formation to its next support at $0.5556. However, for the price to be in bullish sentiment it must close above $2.14 resistance. Thus,it may rise to its next resistance at $2.69.
Technical levels
Resistance Levels: $2.14 and $2.69.
Support Levels: $0.9972 and $0.5556.
Disclaimer
The views and opinions stated by the author or any other person named in this article are for informational purposes only. They do not provide financial, investment, or other advice. Investing in or trading comes with a risk of financial loss.




