
 Boomer
 Minter
 Pearl
Pearl Pudgy Penguins
 Sui
Sui Covenant x402
 Pump.fun
- The TSCO stock price is up by 1.22% since the last trading session.
- The price is currently sustaining above a very crucial support level.
Tractor Supply Co. (NASDAQ: TSCO) is a retail chain of stores that was established in 1938. The company deals in the sales of retail farm and ranch products. The firm sells products for home improvement, agriculture, lawn & garden maintenance, and livestock for farmers, ranchers, and landowners.
Tractor Supply Co. (TSCO) Stock: Technical Analysis
At press time, the TSCO stock price is at $206.01 with a market capitalization of $22.416 Billion. The company’s stock trades with an average 10-day trading volume of 1.009 Million.
Are Sellers Overpowering the Buyers in the TSCO 1-Day Chart?
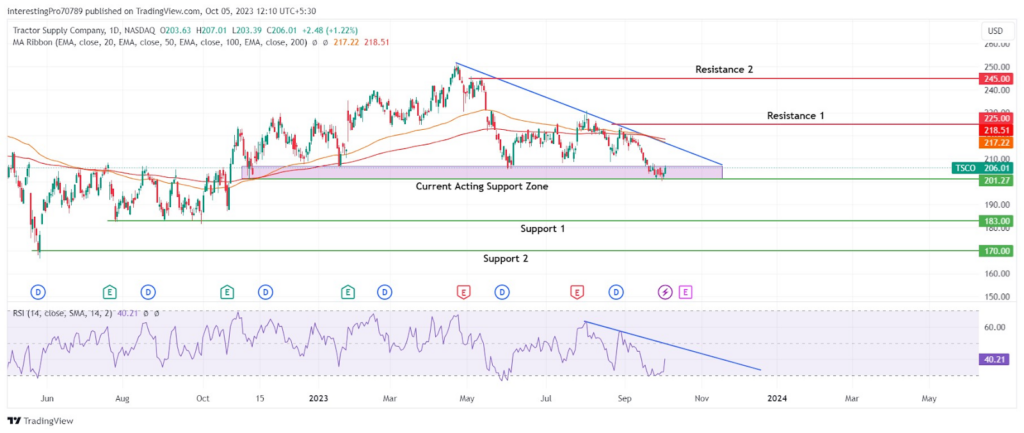
The TSCO stock price has been sustaining above the $201.27 level for almost a year. After creating its all-time high of $251.17, the sellers reversed the bullish trend. After this, the price fell back to the $201.27 support level, forming a pattern of lower highs. Currently, the price is trading above the $201.27 support level.
The 100 EMA and 200 EMA have shown a crossover and have started to slope in the downward direction. The price is also trading below these EMAs, which shows that the sellers are in control in the current scenario.
The relative strength index (RSI) line is at 40 which is marked as a bearish territory. However, the RSI line has started to slope in the upward direction, inviting buyers. By looking at the RSI movement we see that the RSI line has also fallen by making lower highs and it also has trendline resistance. If it faces rejection from the trendline and starts to slope in the downward direction, it will again be seen in bearish territory.
Currently, sellers are trying to make the price close below the $201.87 support zone. A trendline resistance is stopping the price from rising and the strong support level of $201.27 is not letting the price fall. The price is indecisive, inviting both sellers and buyers in the current scenario.
If the price breaks below the $201.27 support zone and sustains below it, forming strong bearish candles, it may fall to its next support at $183.00 and then to $170.00, which will act as the targets on the downside.
However, for the price to regain its bullish momentum, it must give a breakout of the trendline with a strong volume bullish candle. Then it may rise to its next resistance at $225.00 and then to $245.00 which will act as the targets on the upside.
Conclusion
The overall trend for TSCO stock is bearish after it started to fall from its all-time high. The current scenario is indecisive as the price is facing pressure from both the sellers and buyers. However, the sellers have more control over the price compared to buyers. If the price gives the breakdown of the $201.27 support level, it may then fall to its next support level.
However, if the price gives the breakout of the trendline then it may rise to its next resistance levels.
Technical levels
Resistance Levels: $225.00 and $245.00.
Support Levels: $201.27, $183.00, and $170.00.
Disclaimer
The views and opinions stated by the author or any other person named in this article are for informational purposes only. They do not provide financial, investment, or other advice. Investing in or trading comes with a risk of financial loss.




