
 Boomer
 hi
hi Covenant x402
 NEAR Protocol
 Injective
 Quantus
 Solana
- The MRK stock price is up 0.39% since the last trading day.
- Merck & Company’s COVID Treatment distribution shifts to the commercial market.
Merck & Co., Inc. (NYSE: MRK) Is a healthcare company that was founded in 1891. The company provides health solutions through its prescription medicines, vaccines, biologic therapies, animal health, and consumer care products.
The company’s COVID treatment distribution shifts to the commercial market as the US government has decided not to give the free dose of MRK COVID-19 antiviral medication. They are also starting to make it available for commercial purchase.
Merck & Company (MRK) Stock Analysis
The MRK stock price is trading at $102.17 at the time of writing, with a market capitalization of $259.259 billion. MRK stock trades with an average 10-day trading volume of 5.96 million. In the last trading session, MRK stock traded with a volume of 6.721 million.
Is MRK Price Continuing its Downtrend in 1-Day Chart?
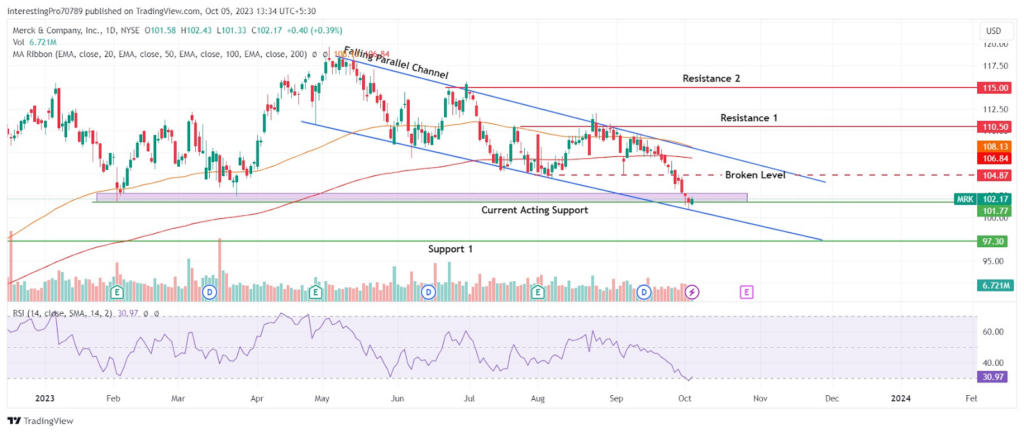
While monitoring the 1-day chart of MRK stock, the price seems to be trading inside a falling parallel channel. Recently, the price reached its $101.77 support level. Currently, it is taking support from the $101.77 level and also from the lower trendline of the falling parallel channel.
The price has recently broken below both the 100-day and 200-day Exponential Moving Averages (EMAs) and is currently trading below these levels. This suggests a bearish sentiment in the short to medium term. However, it’s worth noting that the price may experience a minor pullback and could potentially retest the 100 EMA line, which is currently a bit distant from the current price.
The relative strength index (RSI) line is at 30.97 which is marked as a bearish territory. However, the RSI line has also started to slope in the upward direction, indicating that a recovery in the price could happen in the short term.
After analyzing the price movement and looking at the indicators, it can be surmised that the price can recover and retest the $104.87 level. After that, it could continue its downtrend if it forms a strong bearish candle at the time of retesting. In such a scenario, it may fall to its next support at $97.30 or take support from the lower trendline of the parallel channel.
For the price to gain bullish momentum, it must reclaim the $101.77 level at the time of retesting and give the breakout of the parallel channel. It may then rise to its resistance level at $110.50. If it gives the breakout of the $110.50 level, it may rise to its next resistance at $115.00.
Conclusion
The overview of the MRK 1-day chart shows that the price is moving with bearish momentum and is falling down inside a parallel channel. The price has recently taken support from the lower trendline of the parallel channel and the $101.77 support level. The price could be seen moving in a short-term recovery mode from here. After the recovery, it could resume its downtrend.
Technical levels
Resistance Levels: $104.87, $110.50 and $115.00.
Support Levels: $101.77 and $97.30.
Disclaimer
The views and opinions stated by the author or any other person named in this article are for informational purposes only. They do not provide financial, investment, or other advice. Investing in or trading comes with a risk of financial loss.




