
 streamoors
 Celestia
 Injective
 Pudgy Penguins
 NEAR Protocol
 Pearl
Pearl Starknet
- In 2023, Total Energies was ranked the 21st largest public company in the globe by Fortune Global 2000.
- Total Energies is a French multinational petroleum and integrated energy company. The company was founded in 1924. It DR (Depositary Receipt) is traded on NYSE.
- The businesses covered by TTE are crude oil, natural gas, transportation, refining, power generation, petroleum product marketing, and International oil product trading.
The market capitalization of TTE is 153.314 Billion. The firm’s financial position is good from the previous year. The current market price of the TTE stock is around $63.99.
In 2022, the firm’s Revenue was $280.999 Billion. The revenue increased by 42% from 2021. Its Operating Income in 2022 was $42.5 Billion. The Operating Income increased around 93% from 2921. The firm’s Net Income in 2022 was $21.044 Billion which increased around 28% from 2021.
TTE DR all in all was up by around 471%. In the previous 5 years, it was up by around 3.91%. The Previous year, it was up by around 29.27%. In the previous 6 months, it was up by 1.09%.
Technical Analysis of TTE
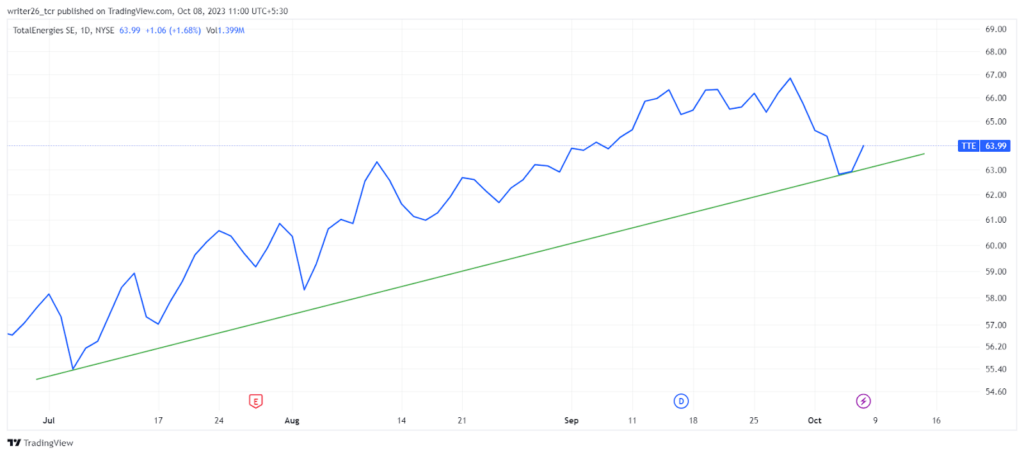
On 21 May 2008 in the daily time frame, the TTE DR reached its all-time high, which was around $91. Today, the stock is up by 1.67%. It means the share rose by $1.05. In the last 4 Quarters of 2022, ROE (Return On Equity) of TTE dr was in Q1- 13.91%, Q2- 16.61%, Q3- 18.02%, and Q4- 17.28%. As we can see, TTE dr took support from the support level and started to move upward. In the past trading days, TTE Dr has been in a good run.
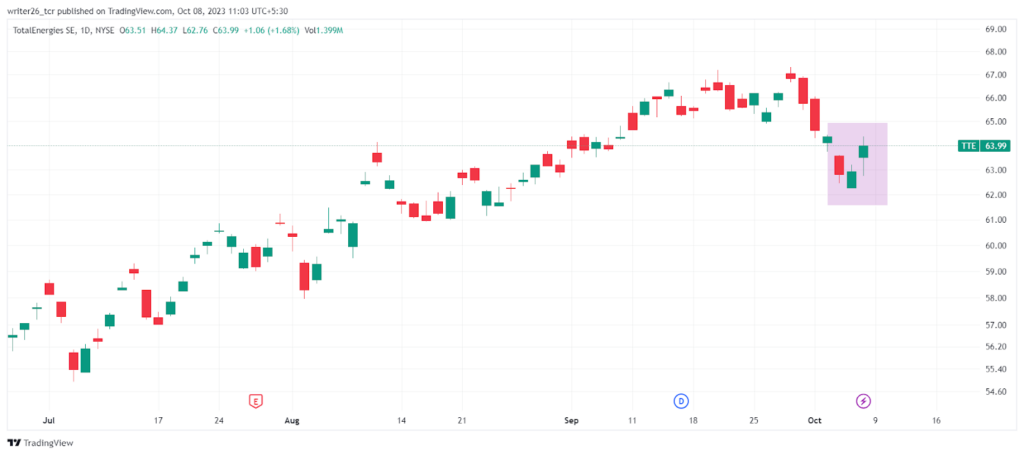
The pattern is known as the “Bullish Morning Star Pattern”. It confirms that the prices will continue to go up in the daily time frame. This pattern appears when the price is falling and indicates that the price will go up in the future after its formation. Greed and Fear show 39 (Fear). The price changing rate was around 1.71% over the last 30 days. The stock recorded 14/30 green days in the last 30 days, which is around 47%. The current market sentiments of TTE are bullish.
SMA and EMA (50,100,200)
SMA 50- $ 62.61 (Buy) and EMA 50- $ 62.01 (Buy)
SMA 100- $ 60.38 (Buy) and EMA 100- $ 60.21 (Buy)
SMA 200- $ 56.06 (Buy) and EMA 200- $$ 57.32 (Buy)
Live Chart of TTE
Conclusion
As per the analysis, we can say that the TTE DR is performing well in the daily time. It is suitable for the short-term duration because of its uptrend momentum. The analysis is done to provide technical information about the stock.
The TTE stock might continue its bullish momentum in the future. In the 5-D time frame, it was down by 3.00%. The stock is good for investors’ portfolios as it might provide good returns to its investors in the future.
Technical Levels
Support level- $56.62
Resistance level- $66.31
Disclaimer
This is a general article that does not provide any financial information. Investors should focus on both technical analysis as well as fundamental analysis. The analysis is done to provide information to readers. To make them aware of investments.



