
 Bitcoin
 Quack AI
 Pudgy Penguins
 Quantus
 Solana
 Injective
 NEAR Protocol
- The stock price is currently trading at $157.64 while observing an increase of 0.32% during the intraday trading session.
- JNJ price has made a falling wedge pattern in the price chart, bulls are expecting a breakout.
Johnson & Johnson (NYSE: JNJ) was founded in January 1886 in New Jersey, United States. It’s an American multinational, pharmaceutical, and medical technology company. It offers its products in many regions of the world. It offers consumer products through retail outlets and distributors.
Previous Actions of the Stock Price
In the month of January 2023, the stock price dropped more than 16%. This fall led to the breakdown of an important support level of $159.21, which caused a change in character of the price structure.
After that, the price formed a new supply zone at the $174.91 level. This again caused a fall of more than 12% of its price value. This scenario shows that the price is currently trading in a downtrend.
The company annualized its dividend at $4.76 per share and the current yield at 3.02%. It has a one-year target of $179.50 with a yearly range of $181.03 to $150.11. It has $4.94 as Earning-per-share (EPS).
The JNJ stock holds a total market capitalization of $409,701,566,798 with an average trading volume of 6,429,776.
Technical Analysis and Price Prediction of the JNJ Stock
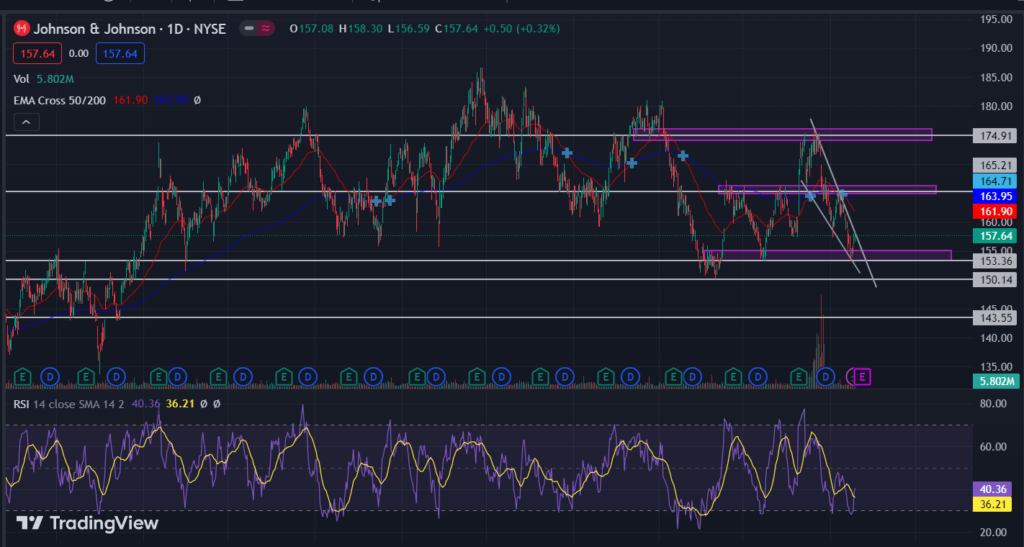
The stock price has been trading in a downtrend since April 2022. At current, it dropped more than 6% by facing the resistance from the 50-day EMA and the 200-day EMA. That indicates the current dominance of bears over the price.
At present, the JNJ stock price is trading at $157.64 by taking support from the $153.36 level. It has formed a falling wedge pattern that has a possibility of breakout by the bulls. In the last four trading sessions, buyers got active in the demand zone. The immediate support and resistance levels are $153.36 and $165.21.
Furthermore, the RSI line is sloping at 40.36 toward the 50-mark middle band by making a bullish crossover with the signal line at 36.21. It formed a double-bottom pattern as compared to the price chart. It is a hidden bullish divergence that reflects bulls’ presence at that price level.
Conclusion
The JNJ stock price is trading in a bearish price structure. It forms a falling wedge, which can possibly give a breakout or a breakdown. If it gives a breakdown of the support level of $153.36, it may drop to the $143.55 level. However, if the price somehow manages to give a breakout of the falling wedge pattern, it may rise to $174.91.
Technical Levels
- Resistance levels: $165.21 and $ 174.91
- Support levels: $153.36 and $143.55
Disclaimer
The views and opinions stated by the author, or any person named in this article, are for informational purposes only. They do not establish financial, investment, or any other advice. Investing and trading in the stock market comes with the risk of financial loss.




