
 Minter
 Quack AI
 NEAR Protocol
 Pearl
Pearl Sui
Sui Pons
Pons Quantus
- After a fall of more than 20%, the price is moving toward the upper range of the price structure.
- The 50-day EMA has made a bullish crossover with the 200-day EMA in September 2023.
AbbVie Inc. (NYSE: ABBV) is an American pharmaceutical research and development company. It is the 6th largest biomedical company by revenue. The company produces Drugs, medicines, and solutions for the therapeutic areas of the human body. It also offers treatment for diseases, such as Alzheimer’s and Parkinson’s.
Previous Actions of the AbbVie Stock
In November 2021, the stock price surged 66% with the strong bullish impulsive momentum created by the investors. It reached the $175.91 level, which became an important resistance for the ABBV stock price for the continuation of an uptrend.
After the surge, the bears reclaimed the price and that led it to range between the $168.16 and $131.84 levels. In this big range, the buyers and sellers have failed to break any of those levels. The 50-day EMA made a bearish crossover with the 200-day EMA in May 2023. It helped the bears to make a lower range for them.
At the end of the second quarter of 2023, the bulls came to the stock. After that, the ABBV stock price increased by more than 17%. At the press time, the ABBV price is consolidating in a small range between $154.91 and $143.66.
Technical Analysis of the ABBV Stock
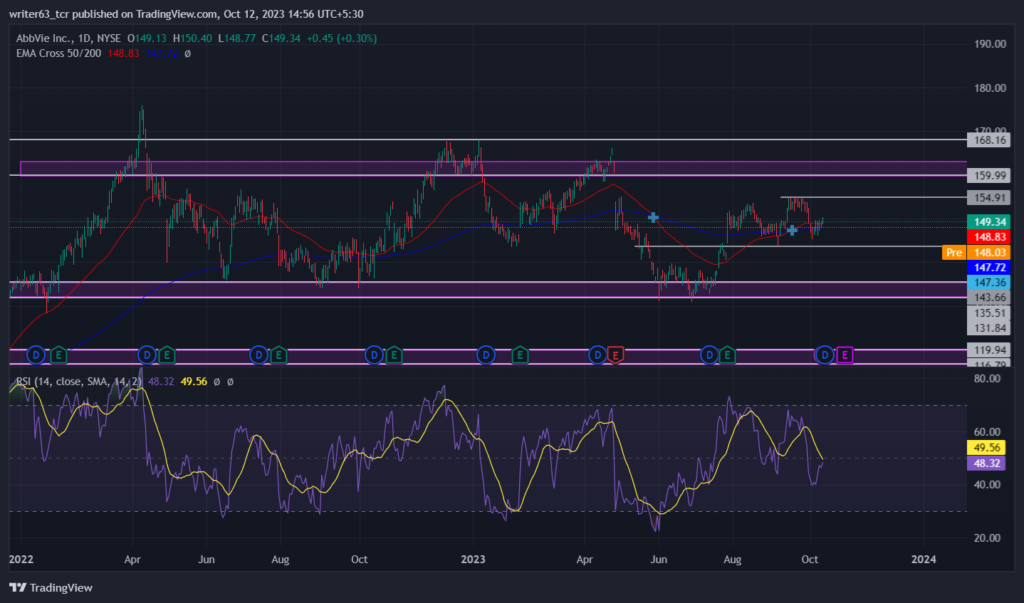
The 50-day EMA has made a bullish crossover with the 200-day EMA. The stock price has got support from the 50-day EMA and the 200-day EMA, showing the bulls are buying positions at that level.
At present, the price is trading at $149.34 after taking support from the $143.66 level. It is moving towards the immediate resistance at $154.91. At this level, the bears are consistently increasing their positions. However, as per the price action, it may rise up to $159.99. The other support and resistance levels are $168.16 and $131.84, respectively.
According to the relative strength index (RSI) slope, it shows a bearish divergence in the nature of the stock price. Indicating the sellers have more momentum compared to the buyers at the current price range.
Conclusion
Overall, the ABBV stock price is trading between a big price range of $168.16 and $131.84. At present, it is moving toward the immediate resistance at $154.91. Therefore, the price prediction for this stock will be bullish. If the price gives a breakout of $154.91, it may rise up to $159.99 levels. Suppose the ABBV stock price breaks above the $168.16 level, it may continue the bullish trend.
Technical Levels
- Resistance Levels: $154.91 and $168.16
- Support levels: $143.66 and $131.84
Disclaimer
The views and opinions stated by the author, or any person named in this article, are for informational purposes only. They do not establish financial, investment, or any other advice. Investing in or trading crypto and stocks comes with the risk of financial loss.




