
 Quack AI
 Bitcoin
 Lighter
 Injective
 Pearl
Pearl Zcash
Zcash Sui
Sui
- United States Steel Corporation stock created a new 52-week high in the last trading session.
- United States Steel Corporation stock has given a breakout of the symmetrical triangle pattern.
- Rating Firm Morgan Stanley upgraded the rating of the stock from equal-weight to overweight.
United States Steel Corporation (NYSE: X) has created a new 52-week high in its last trading session. The stock price is now inching toward the high of the year 2022. If we look at the broader picture, the stock price has been trading sideways since 2009. In 2008, the stock corrected massively by over 89% in a year. The reasons for this fall were production cuts, layoffs, and fear of demand.
Since then, X stock has never risen back to that level and has been trending sideways for more than 14 years. It has surged by over 2.66% in a week, 8% in a month and 76% in a year. This indicates that the stock has been dominated by the bulls throughout the year. Even after the poor financial performance, the company is showing great strength.
Outlook of the United States Steel Corporation Stock Chart
X stock has recently broken the symmetrical triangle pattern and the price is currently sustaining above the pattern. The stock witnessed a huge gap-up opening on 14th August 2023, and the price retested the pattern on that day. It is trading above the 50-day and 100-day Exponential Moving Average which is a bullish sign for the stock. The stock has witnessed a bullish crossover on the breakout day.
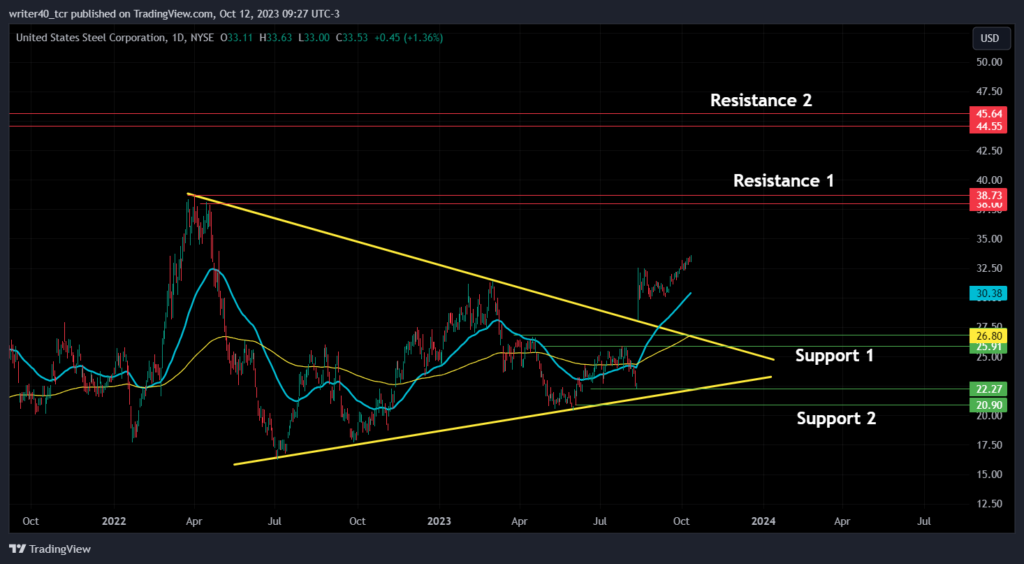
X stock is now trading at the 52-week high and is showing strength. It can face some rejection from the resistance level of $38. Apart from this, the other resistance level is present at $44.55. The support levels for the stock are present at $26.80 and $25.91. Apart from this, the other supports are present at $22.27 and $20.90.
What Bollinger Bands is Indicating?
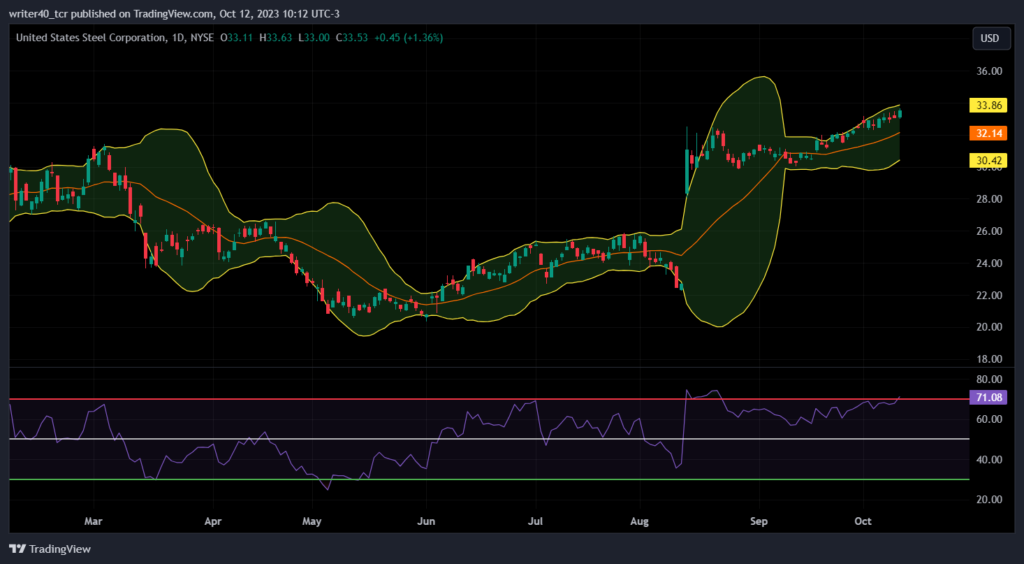
Bollinger bands show a narrow range, which indicates that the stock is currently less volatile. The upper band of the indicator is present at the $33.86 level with the lower band at the $30.42 level. The stock price is currently trading very close to the upper band, which can provide liquidity to the stock.
Relative strength Index
The relative strength index (RSI) indicates that the stock is currently overbought. It needs to cool down or show some correction before the upward move. The RSI is placed at 71.08, which shows that the stock is heavily bullish.
Conclusion
Both the Bollinger Bands and the RSI suggest that the stock is due for a correction. The current price appears to be in an overbought condition. If the stock declines from here, then it may fall to the $26.80 and $22.27 support levels. On the other hand, if the stock resumes this uptrend, then it will face resistance near the levels of $38.73 and $44.55
Technical level
Resistance – $38.7 and $44.55
Support – $26.80 and $22.27
Disclaimer
The views and opinions stated by the author, or any people named in this article, are for informational purposes only. They do not establish financial, investment, or other advice. Investing in or trading crypto assets comes with a risk of financial loss.




