
 Quack AI
 Pearl
Pearl Solana
 NEAR Protocol
 Canton
 XRP
XRP Derive
- RBC Capital has maintained its outperformer rating on the Uber Stock.
- Uber Technologies has formed a horizontal range near its one-year high level.
- Uber Technologies has posted a huge net loss of $9.14 Billion in the last financial year.
The Uber Technologies stock has been consolidated from August 2023. It has been in a downtrend since February 2021, as the stock has declined by over 68% till June 2022. It has formed a base and after that, the price has consolidated for a few months before breaking out of that range. However, the current market price of the stock i.e. $45.95 is very close to its listing price.
Uber Technologies has been rated by the rating firm RBC Capital. It has maintained its previous rating of outperformer with a target price of $58.33. Several other firms have also maintained a buy rating on the stock, which can boost the share’s price in the near future. The stock has been struggling to cross the resistance as it is very crucial before the All-time high level.
Uber technologies have reacted positively to the recent few quarterly results. It has reported great financial growth over the past few quarters. It can provide the necessary boost to the price. However, it has posted a huge net loss in the previous financial year. The company has posted a net loss of $9.14 Billion, the highest in the past 6 years.
Overview of the Uber Technologies Stock Chart.
The Uber stock price is forming a higher high and higher low pattern on the daily chart. It is trading very close to the crucial resistance levels of $48.81 and $52.11. However, the stock price has created a multiple-demand zone near the current market price, which can hold the price up. It will be very interesting to watch where the price moves in the coming time.
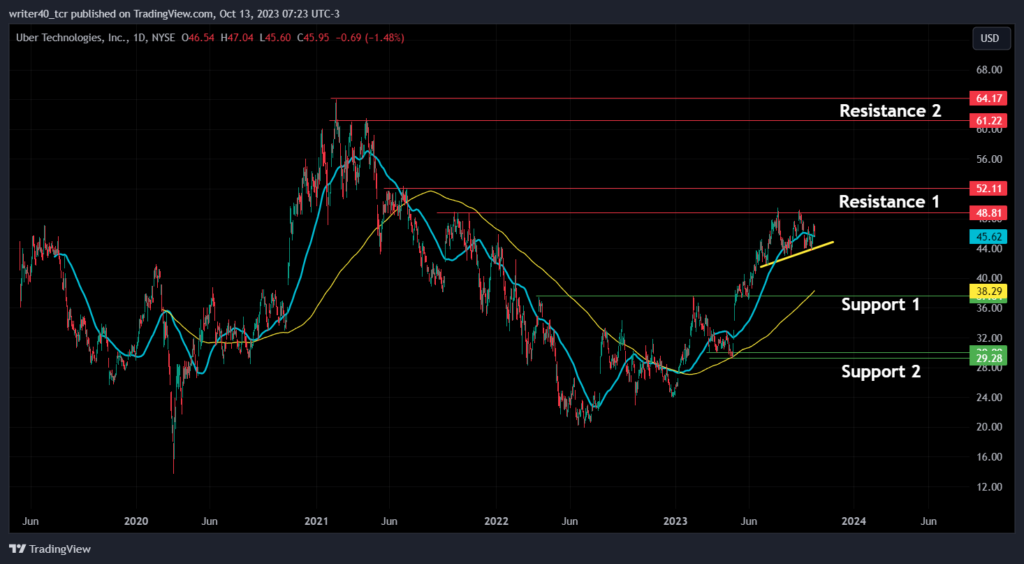
Uber stock price is currently being supported by the rising trendline. It can further create an ascending triangle pattern if it continues to respect this trendline. Uber stock price is currently trading above the 50-day and 200-day Exponential Moving Averages, which is a bullish sign. It has formed some demand and supply zones in this uptrend. The resistance zone is present at $48.81 and $61.22 and support at $37.64 and $30.
A Quick Outlook on the Indicators
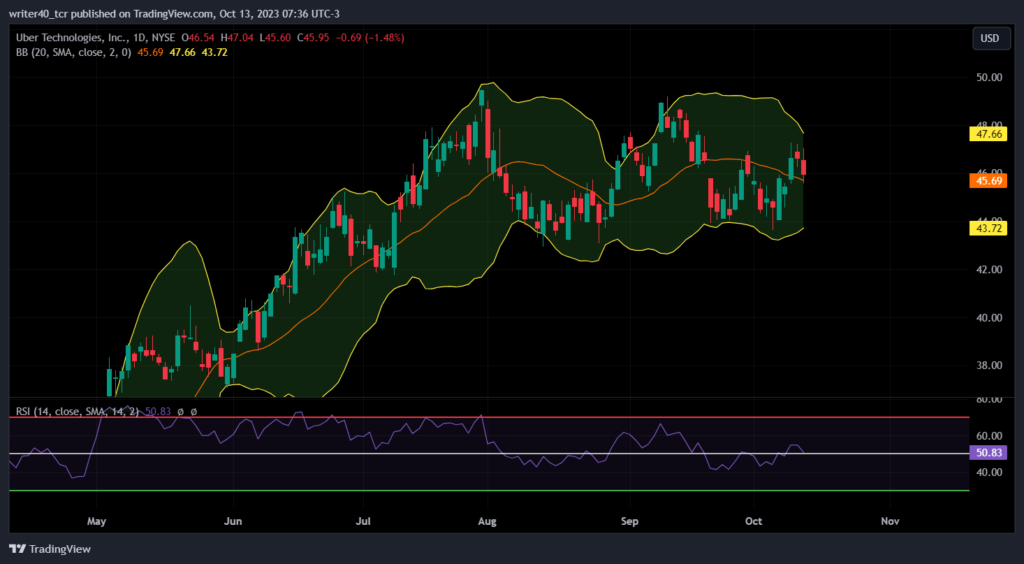
The Uber stock price is currently very close to the Median line of the Bollinger Band, it can reverse from here. A closer look can clear the whole picture, both the upper and lower bands are enclosing. That indicates the price can become range-bound for some time. The Relative Strength Index is currently flat at the 50 level, which indicates a neutral sentiment.
Conclusion
The Uber stock price is very close to its resistance level. If the price breaks this resistance level, it can try to achieve the level of $61.22 level. However, the stock can also break the trendline support and try to achieve the level of $37.64.
Technical level
Resistance – $48.81 and $61.22
Support – $37.64 and $30
Disclaimer
The views and opinions stated by the author, or any people named in this article, are for informational purposes only. They do not establish financial, investment, or other advice. Investing in or trading crypto assets comes with a risk of financial loss.




