
 Boomer
 Pearl
Pearl Covenant x402
 Claudia
 Bitcoin
 hi
hi NEAR Protocol
- JP Morgan has maintained a Neutral Rating on the Walgreens Boot Alliance stock.
- The Walgreens Boot Alliance Stock price has jumped by over 7% in the last trading session.
- Walgreens Boot Alliance Stock price is trading below the 50-day and 200-day Exponential Moving Averages.
Walgreens Boot Alliance stock price has been in a strong downtrend as the stock price has corrected by over 25% in a year. However, if we look at the broader picture, the stock price has been corrected over 67% since this downtrend started. It has been following a bearish chart structure of lower highs and lower lows.
Walgreens Boot Alliance stock price has surged by over 7% in the previous trading session. It indicates that the stock price is slowly gaining momentum on the bull’s side. It has been creating some bullish candles on the daily chart, along with some reversal candles near the support level.
The Walgreens Boot Alliance share price has formed an inverted head and shoulder pattern. It has recently breached the neckline, which was present near the level of $22.73. The stock price has retested the neckline level, which confirms the authenticity of this breakout.
A Quick Sight on the Walgreens Boot Alliance Share Chart
The WBA stock price has been in a downtrend and this downtrend is supported by the downward-sloping trendline. It has faced a rejection from the 50-day exponential moving average. The Slope of the EMA is steep, which can create some difficulty for the stock to move up. However, the stock price movement in the last trading session has formed a bullish pin bar on the support level.
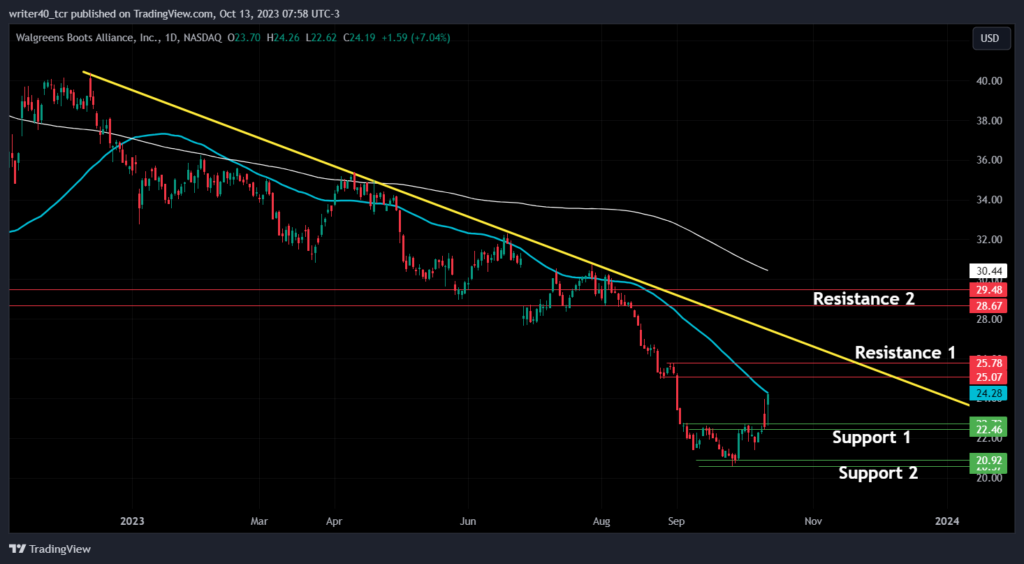
WBA stock price has created a support level at $21 and $20.50. The nearest support for the price is present at the level of 22.70. If we consider the resistance level, it is present near $25.07 and $28.67. These levels are marked as resistance 1 and resistance 2 respectively on the chart.
What Bollinger Band and RSI are indicating
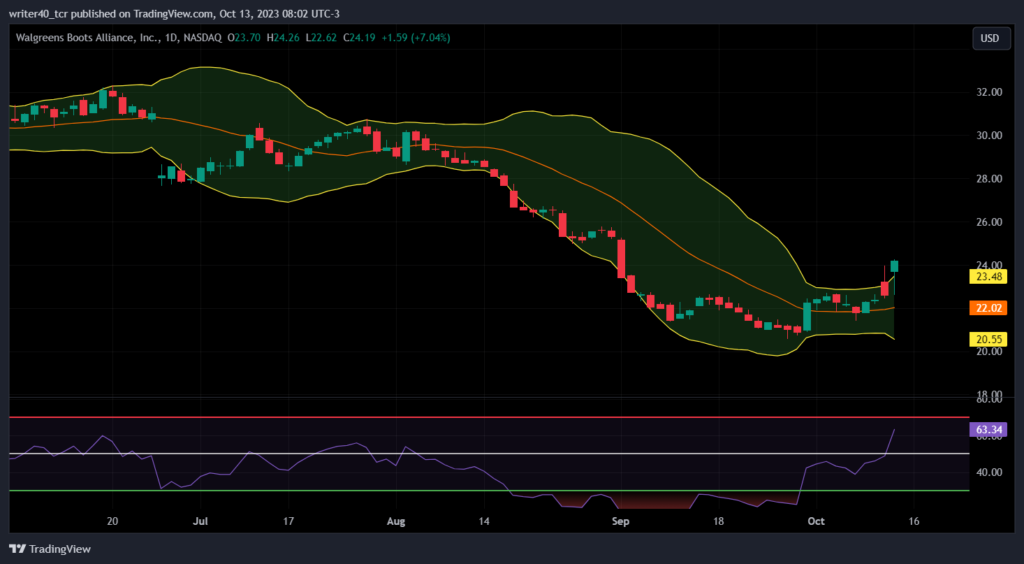
Recent price action in the stock made it cross the upper band of the Bollinger Band. The stock price can try to continue this trend ahead. It has created a strong bullish candle, which shows that the buyers have absorbed the selling and created some buying position. Along with the Bollinger Band, the RSI is also telling the same story. It is currently placed at 63.34 which indicates that the price is heavily bullish.
Conclusion
WBA stock price has shown some great reversal signs, it seems like the stock will try to shift the trend. Currently, the stock price has broken the bearish structure as the stock has formed a higher high and higher low. If the price rises from here, then it can face a hurdle near the price of $25.07 and $28.67. If the stock reverses from here, the price can find support at $22.70 and $21.
Technical level
Resistance – $25.07 and $28.67
Support – $22.70 and $21
Disclaimer
The views and opinions stated by the author, or any people named in this article, are for informational purposes only. They do not establish financial, investment, or other advice. Investing in or trading crypto assets comes with a risk of financial loss.




