
 Celestia
 Pearl
Pearl Quantus
 Zcash
Zcash Hyperliquid
 Aerodrome Finance
 NEAR Protocol
- Tigress Financial maintains its buy rating on the Cisco Systems stock.
- The Cisco system stock (CSCO) has surged by over 37% in a year.
Cisco system has shown a significant surge since October 2022. CSCO stock price has declined by $0.08 with a fall of 0.15% in the last trading session. It has witnessed a decline of 4.53% in a month, which shows that the stock has been under the grip of
the Bears. However, the stock has jumped by over 37% in a year indicating that the bulls were in the upper hand over this period.
The Cisco Systems stock has breached the critical resistance level of $51.52. It is currently trading above this resistance level, which confirms that the breakout was authentic. The stock price has taken a reversal near the level of $57.9 after it has filled the gap. However, the stock has formed another gap between the level of $55.05 and $54.22.
Cisco Systems has been rated by the Rating firm Tigress Financial. The firm has maintained its rating of buy, with a target price of $76. Previously, the stock has been rated “BUY”, with a target price of $73. It means the rating firm believes that the stock is worth investing in. It can boost the confidence of the retail investors to invest in this stock.
A Quick Glance on the Cisco System Stock Chart
The CSCO stock price is currently trading above the 200-day exponential moving average. However, the stock has breached the 50-day Exponential Moving Average. It indicates that the Bears are in domination in a short-term time frame. It is currently struggling at a 50-day EMA. That suggests the stock is following this 50-day EMA well.
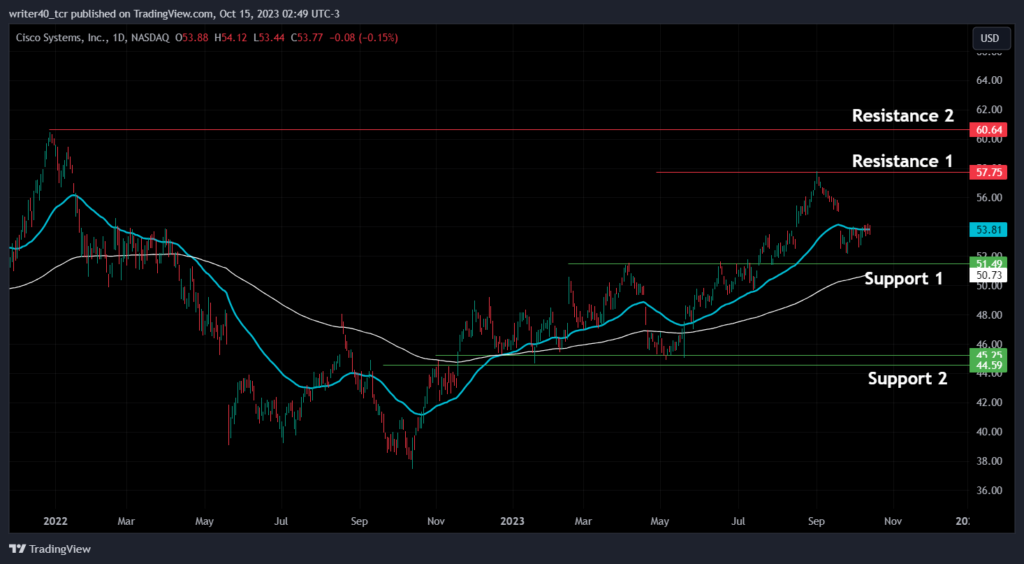
The CSCO stock price has formed many demand and supply zones in this uptrend. The resistance for the price is present near the level of $57.75 and $60.64, these levels are marked in red on the chart. If we consider the support zone for the stock, it is present near the level of $51.49 and $45.25.
An Overview of the Indicators
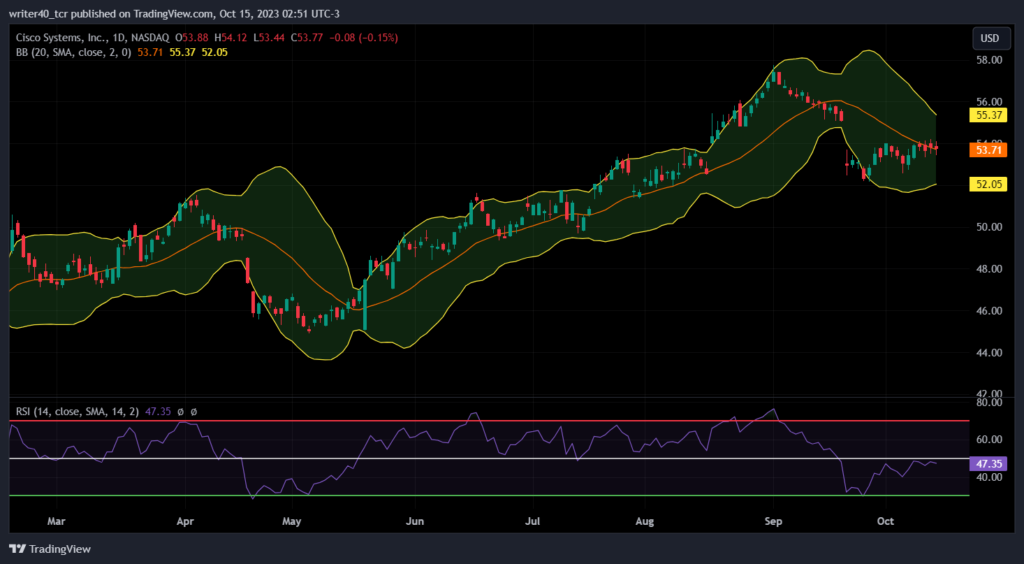
A close look at the Bollinger Bands can clear out the major picture of the stock. The stock price initially closed below the lower band of the Indicator, but then it swiftly closed inside the band. It indicates that the stock price is slowly becoming bullish. The Relative Strength Index is currently placed below the Halfway line, which is a bearish sign.
Conclusion
The CSCO stock price seems like forming a base at the current level. If the stock price is able to defend the support level of $51.49 and rises, it may achieve the level of $57.75. On the other hand, a breakdown from the $51.49 level can trigger some selling towards the level of $45.25.
Technical level
Resistance – $57.75 and $60.64
Support – $51.49 and $45.25
Disclaimer
The views and opinions stated by the author, or any people named in this article, are for informational purposes only. They do not establish financial, investment, or other advice. Investing in or trading crypto assets comes with a risk of financial loss.




