
 Quack AI
 NEAR Protocol
 Monero
 Lighter
 Ethena
 Pons
Pons Sui
Sui
- Seraphim Space Investment Trust Plc has a share float of 203 Million shares.
- SSIT stock’s one-year return is -31.54%.
- Seraphim Space Investment Trust Plc’s technical summary gives a ‘strong sell’ recommendation.
Seraphim Space Investment Trust Plc (LON: SSIT) is a privately managed investment company with a closed-end structure. It specializes in building a well-diversified global portfolio focused on early and growing Space Tech enterprises.
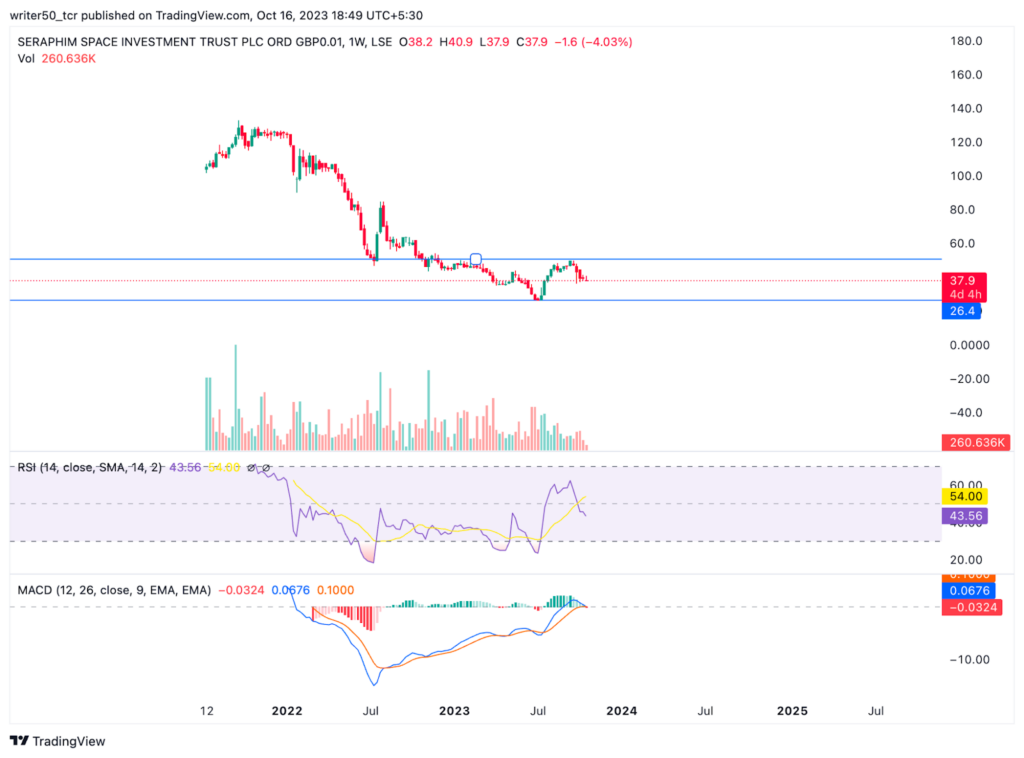
SSIT stock is currently moving in a downtrend. The price has recently hit an all-time low followed by the formation of a lower-low candle structure.
SSIT stock is currently trading at GBX 37.9, reflecting a 4% decrease in today’s market session. The company boasts a trading volume of 168K with a share float of 203 million shares.
It’s important to note that SSIT does not offer dividends to its shareholders, potentially affecting income-focused investors.
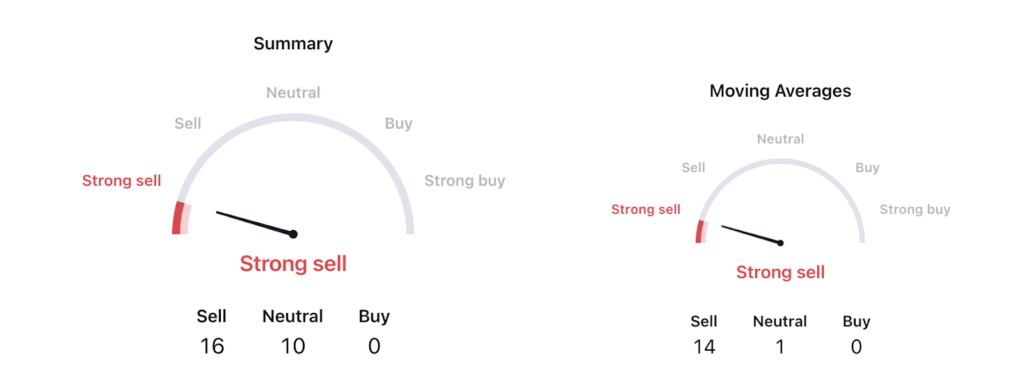
Upon scrutinizing the technical indicators, we find that SSIT stock receives a ‘strong sell’ signal. Among the top 26 indicators, 16 recommend selling, while none advocate buying. Furthermore, the moving averages summary strongly advises selling this stock, indicating a weak trend.
In terms of price action, SSIT reached a peak of GBX 133 in September 2021, after which it entered a declining phase. The price experienced a substantial drop of nearly -80% by the end of June 2023. It hit an all-time low, but subsequently found support at the GBX 26 level, with efforts to stage a rebound. However, the overall structure of the stock appears negative, as it forms a weak pattern. This raises the likelihood of further price declines.
Additionally, SSIT stock delivered a -31% return in the past year. The company’s performance in the preceding year may have implications for the future, with potential sellers gaining an upper hand and buyers losing interest in the stock.
Seraphim Space Investment Trust Plc (SSIT) Stock Price Analysis
Technical Indicators Summary:
Presently, both the RSI line and the SMA line for SSIT stock are positioned around the 40 level, indicating a bearish sentiment. This suggests the potential for a price decrease in the near future.
Furthermore, the MACD line for SSIT stock has recently experienced a bearish crossover, with the signal line moving above the MACD line. This event functions as a bearish signal, implying the possibility of the stock’s price declining to lower levels in the coming days.
SSIT Stock Chart ByTradingView.com
Conclusion
As per the analysis, SSIT stock is currently on a downtrend, with the price making a lower lower-lows pattern. Moreover, the company has reported negative returns in recent months. The overall outlook for SSIT stock appears weak, with the price moving along a downward trajectory. Hence, the price is likely to decline in the upcoming days.
Technical Levels
- Support Level: GBX 26
- Resistance Level: GBX 50
Disclaimer
The views and opinions of the author, or anyone named in this article, are for informational purposes only. They do not offer financial, investment, or other advice. Investing or trading crypto assets involves the risk of financial loss.




